AI Traffic Attribution
New · Aug 2, 2026 Needs testingMeasure the traffic AI assistants (ChatGPT, Perplexity, Gemini, Copilot, and more) actually send you — confirmed AI referrals from your GA4 data, a separate "Possible AI Direct" estimate for referrer-stripped visits, a regex simulator for GA4 channel groups, and a client-ready PDF.
What changed
The Analyze button now says when it will be available again. It is on a per-project cooldown (default 24h), and the button genuinely disables during it — previously it looked clickable and you only learned why by clicking. The time it lifts is shown beside the button, and is suppressed while a run is actually in flight, when the reason for the disable is the run rather than the cooldown.
Still to be tested
This guide and the AI Traffic Attribution feature shipped recently and still need QA walkthrough sign-off.
Use the QA focus checklist below; remove the needs_testing flag in
config/platform-docs/pages/addons.php after the team signs off.
User goal
See how much traffic AI assistants send to the site, which pages they land on, and whether that traffic converts — with numbers defensible enough to put in front of a client.
- Tier
- Team+ (Pennant `ai-traffic-attribution`; rides the project’s GA4 connection)
- Nav label
- AI Traffic
- Route
- /projects/{project}/ai-traffic
- Gates
- ai-traffic-attribution
Prerequisites
- A project on the Team plan or higher (the feature is gated to Team+)
- A connected Google Analytics 4 property (AI Traffic reads GA4 acquisition data — no GA4 connection, no analysis)
- The manage_ai_traffic permission (Owner/Admin) to run an analysis or edit patterns; viewers can read a completed report
QA focus
- Confirmed AI is host-anchored and excludes organic/cpc/paid mediums — google/organic and bing/cpc are never counted as AI even though the host matches
- Possible AI Direct is a range with a Low/Med/High confidence label, never a single point number, and is reported separately from confirmed AI
- Reports, rows, patterns, simulations, and estimates are org+project scoped; a run never spends another org’s GA4 quota
- Analyze is gated by manage_ai_traffic AND a server-side Team+ entitlement re-check — a mid-session downgrade cannot start a run from the Livewire action
- Per-project analyze cooldown (default 24h) prevents repeated GA4 quota spend; a completed/in-flight run inside the window blocks a new one, a failed one does not
- A run stranded by a dead worker is reaped to Failed within ~30 min so the dashboard unlocks and the cooldown clears — the Analyze button never sticks disabled forever
- All five alerts are opt-in / default-off; the risky-regex simulator alert is debounced so iterative testing cannot spam org admins
- The PDF export is branded (co-brand header + OnPageIQ footer) and re-checks view + feature entitlement server-side
Overview
AI Traffic Attribution answers a question GA4 cannot answer on its own: how much of your traffic is actually coming from AI assistants, and is it worth anything? It rides the project’s existing GA4 connection — no new data source to configure.
What you get
- Confirmed AI — host-anchored referrals from known assistants (ChatGPT/OpenAI, Perplexity, Gemini, Claude/Anthropic, Microsoft Copilot, You.com, Phind, Poe, and more), excluding organic/cpc/paid mediums, with sessions, conversions (GA4 key events), engagement rate, and per-landing-page breakdown
- Possible AI Direct — a separate estimate for referrer-stripped visits that arrive as Direct: a per-page session range with a Low/Medium/High confidence label from a config-tunable weighted-signal heuristic (never a single fabricated number)
- Trend chart, top landing pages, regex simulator (test before pasting into a GA4 channel group), and per-org pattern overrides on top of seeded defaults
- Five opt-in alerts (new AI referrer, material change, conversions, Direct spike, risky regex) and a branded, client-ready PDF export
How it works
- Pick a window (7 / 28 / 90 days) and run Analyze AI Traffic; the run is queued and the previous report stays visible while it works
- Analyze is rate-limited by the per-project cooldown in
ai-traffic.analyze_cooldown_hours(failed runs do not consume the cooldown) - Row-grain data is pruned on
ai-traffic.row_retention_dayswhile the report and its summary are kept
Common issues & false alarms
- No GA4 connected → the Analyze button is unavailable with a prompt to connect a Google Analytics 4 property first (Settings → Integrations)
- Analyze greyed out after a recent run → the per-project cooldown (default 24h) is still active; the time it lifts is shown beside the button
- "Analyzing…" seems stuck → a run normally finishes in under a minute; a run stranded by a dead worker is auto-reaped to Failed within ~30 min, after which you can re-run
- Possible AI Direct shows a range, not a number → by design; it is an estimate with a confidence label, kept separate from the confirmed count
- A source you expected as AI is missing → check the simulator; if it is a genuinely new AI host not in the patterns, add it via the pattern manager (or wait for the nightly new-referrer alert if opted in)
- No alerts arriving → all five alerts are opt-in and default OFF; enable them per project in notification preferences
Interactive guide
Step of
What to do
Where to find it
Expected (pass)
Negative cases
Tips
Screenshot pending capture
All steps (reference)
-
Step 1. Run an AI Traffic analysis
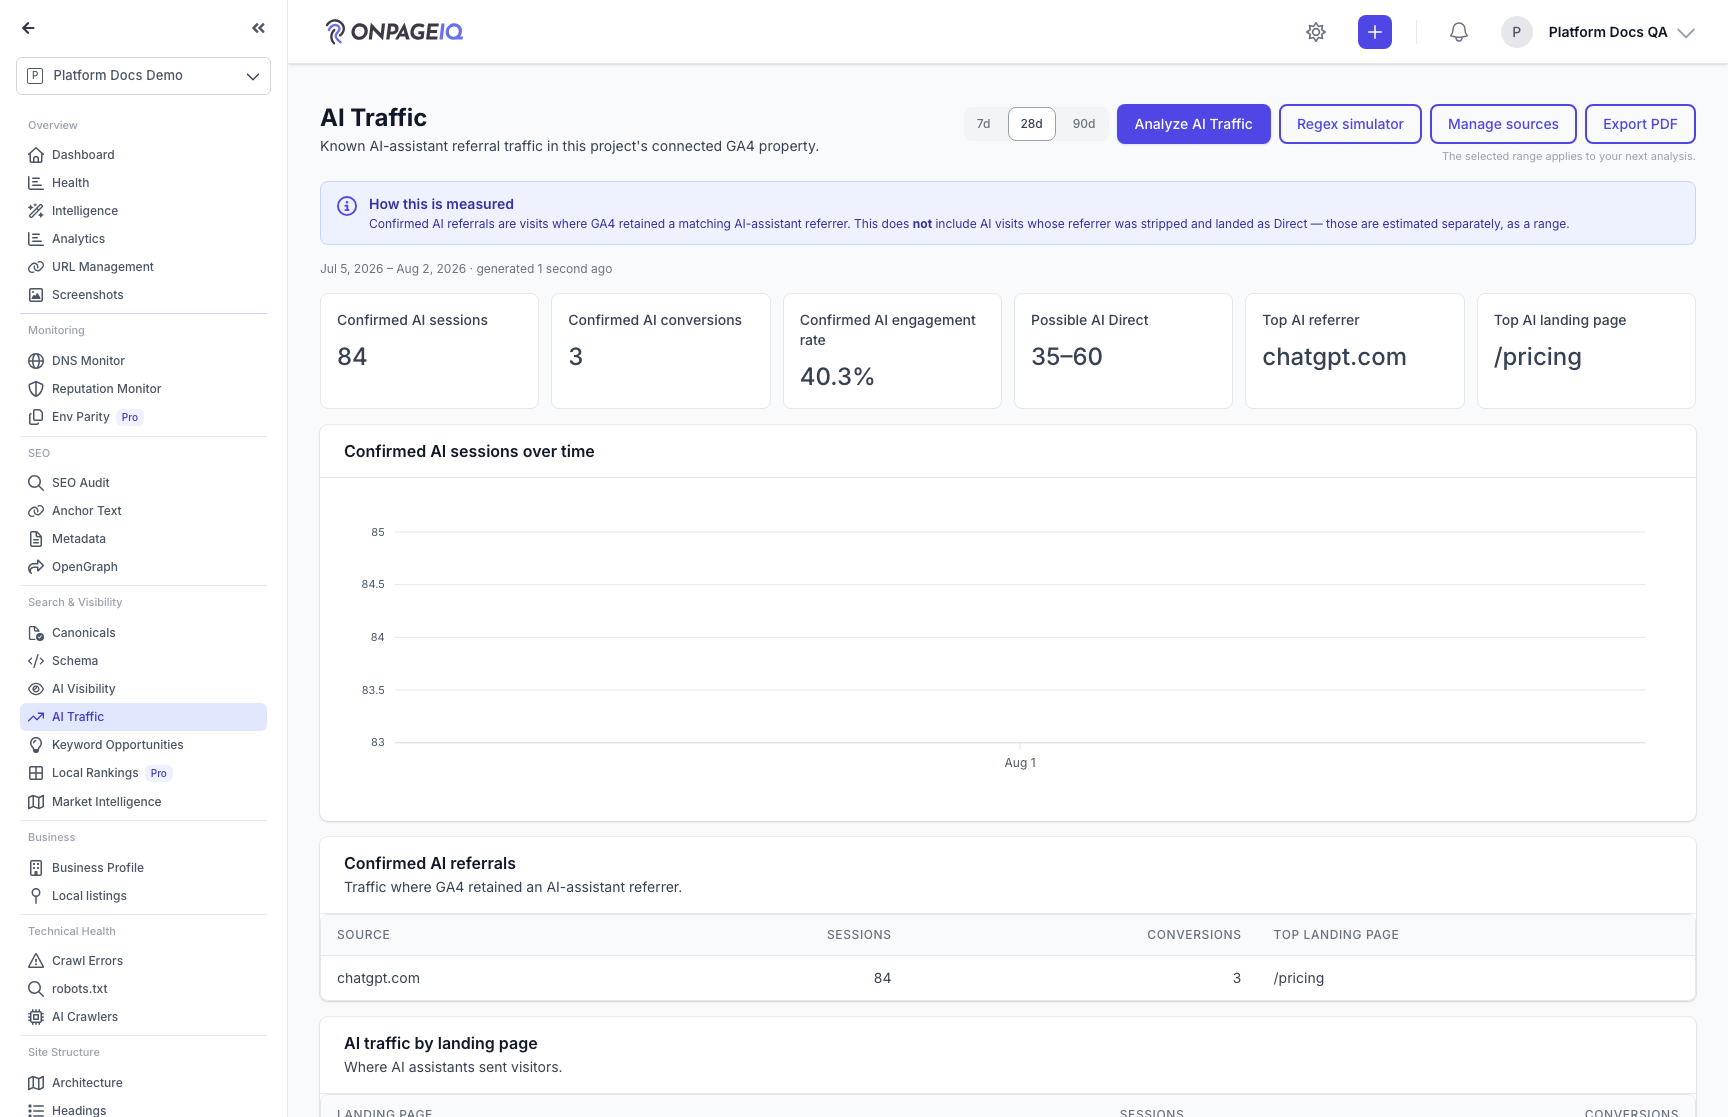
Open AI Traffic from the project sidebar (under Search & Visibility). Pick a window (7, 28, or 90 days) and click "Analyze AI Traffic". The run is queued and pulls your GA4 acquisition data in the background — the page keeps showing the previous report while it works, so triggering a run never blanks the dashboard. A per-project cooldown (default 24h) protects GA4 quota, so the button is greyed out for a while after a successful run, with the time it becomes available again shown beside it.
What to do: GET /projects/{project}/ai-traffic → choose range → Analyze AI Traffic
Where: projects.ai-traffic
Expected (pass)
- Run goes Queued → Running → Completed; the “Analyzing…” state clears on its own
- Analyze requires manage_ai_traffic AND a server-side Team+ entitlement check
- Cooldown blocks a second run inside the window; a failed run does not consume the cooldown
Negative cases (must fail safely)
- No GA4 property connected → Analyze is blocked with a connect-GA4 prompt (no run)
- Viewer without manage_ai_traffic → Analyze is hidden / forbidden (read-only report only)
-
Step 2. Read confirmed AI referrals
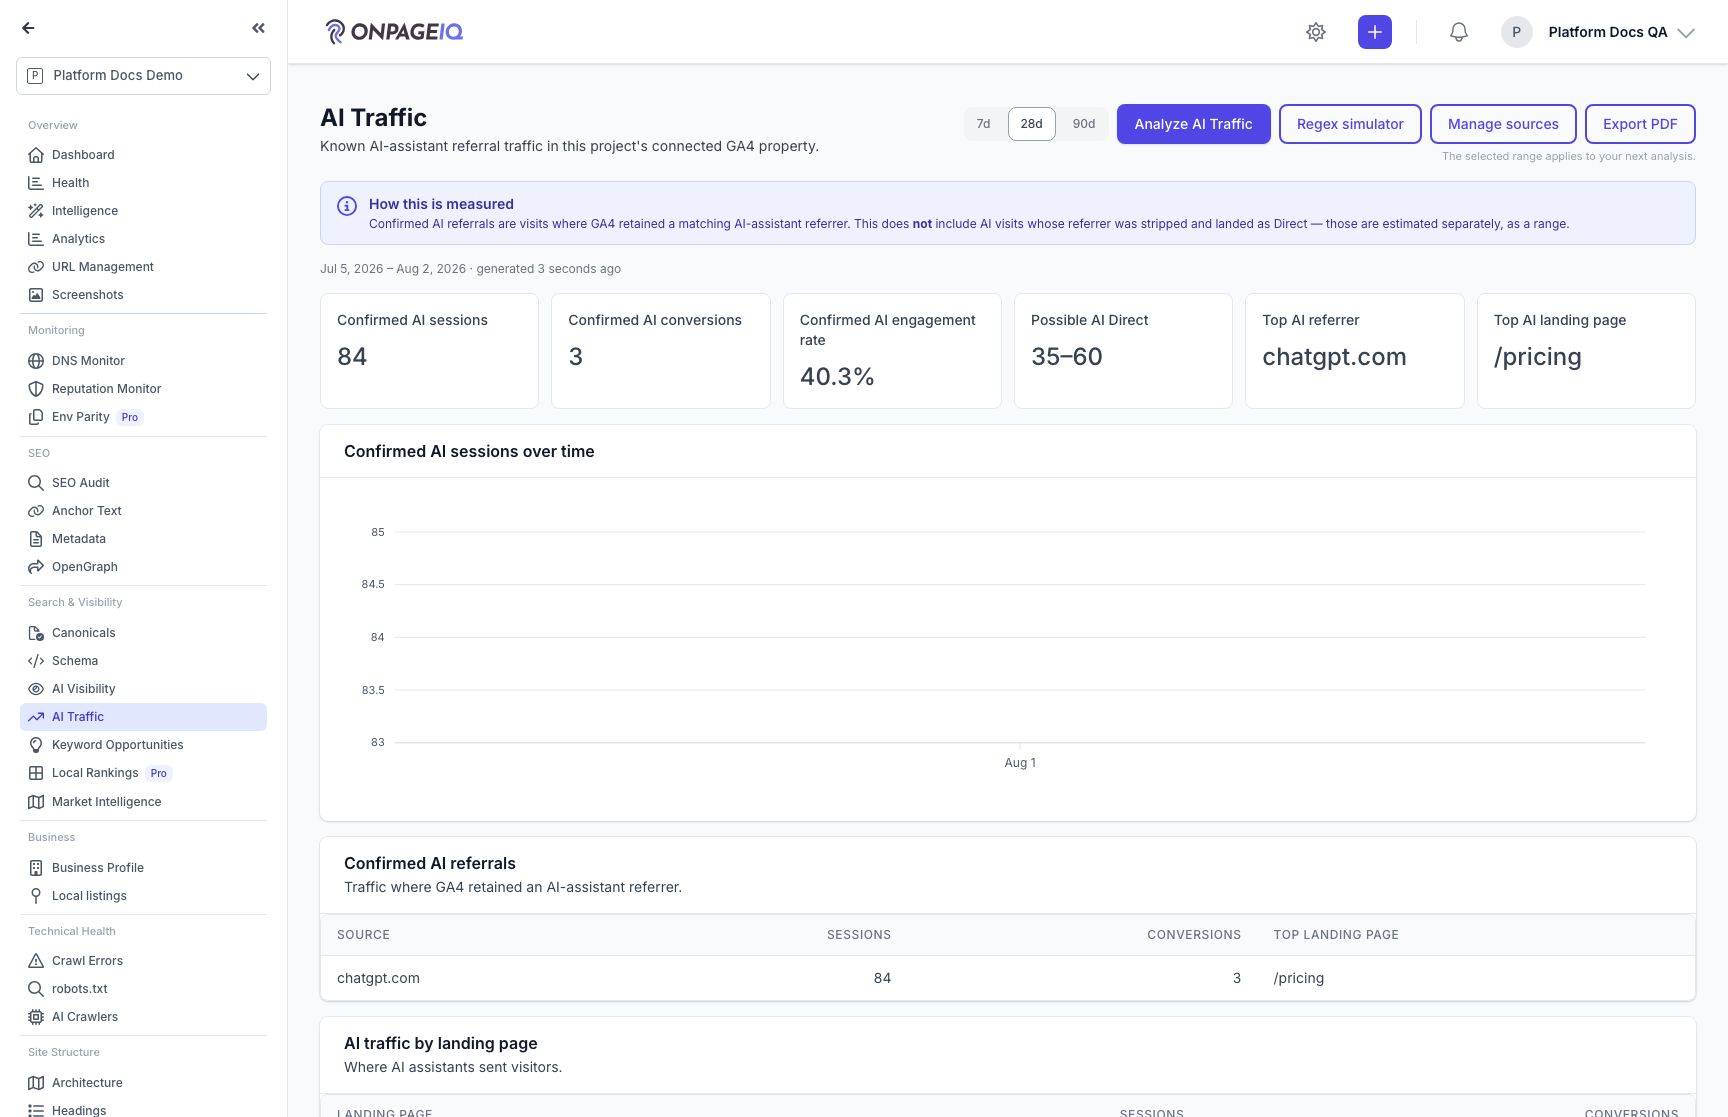
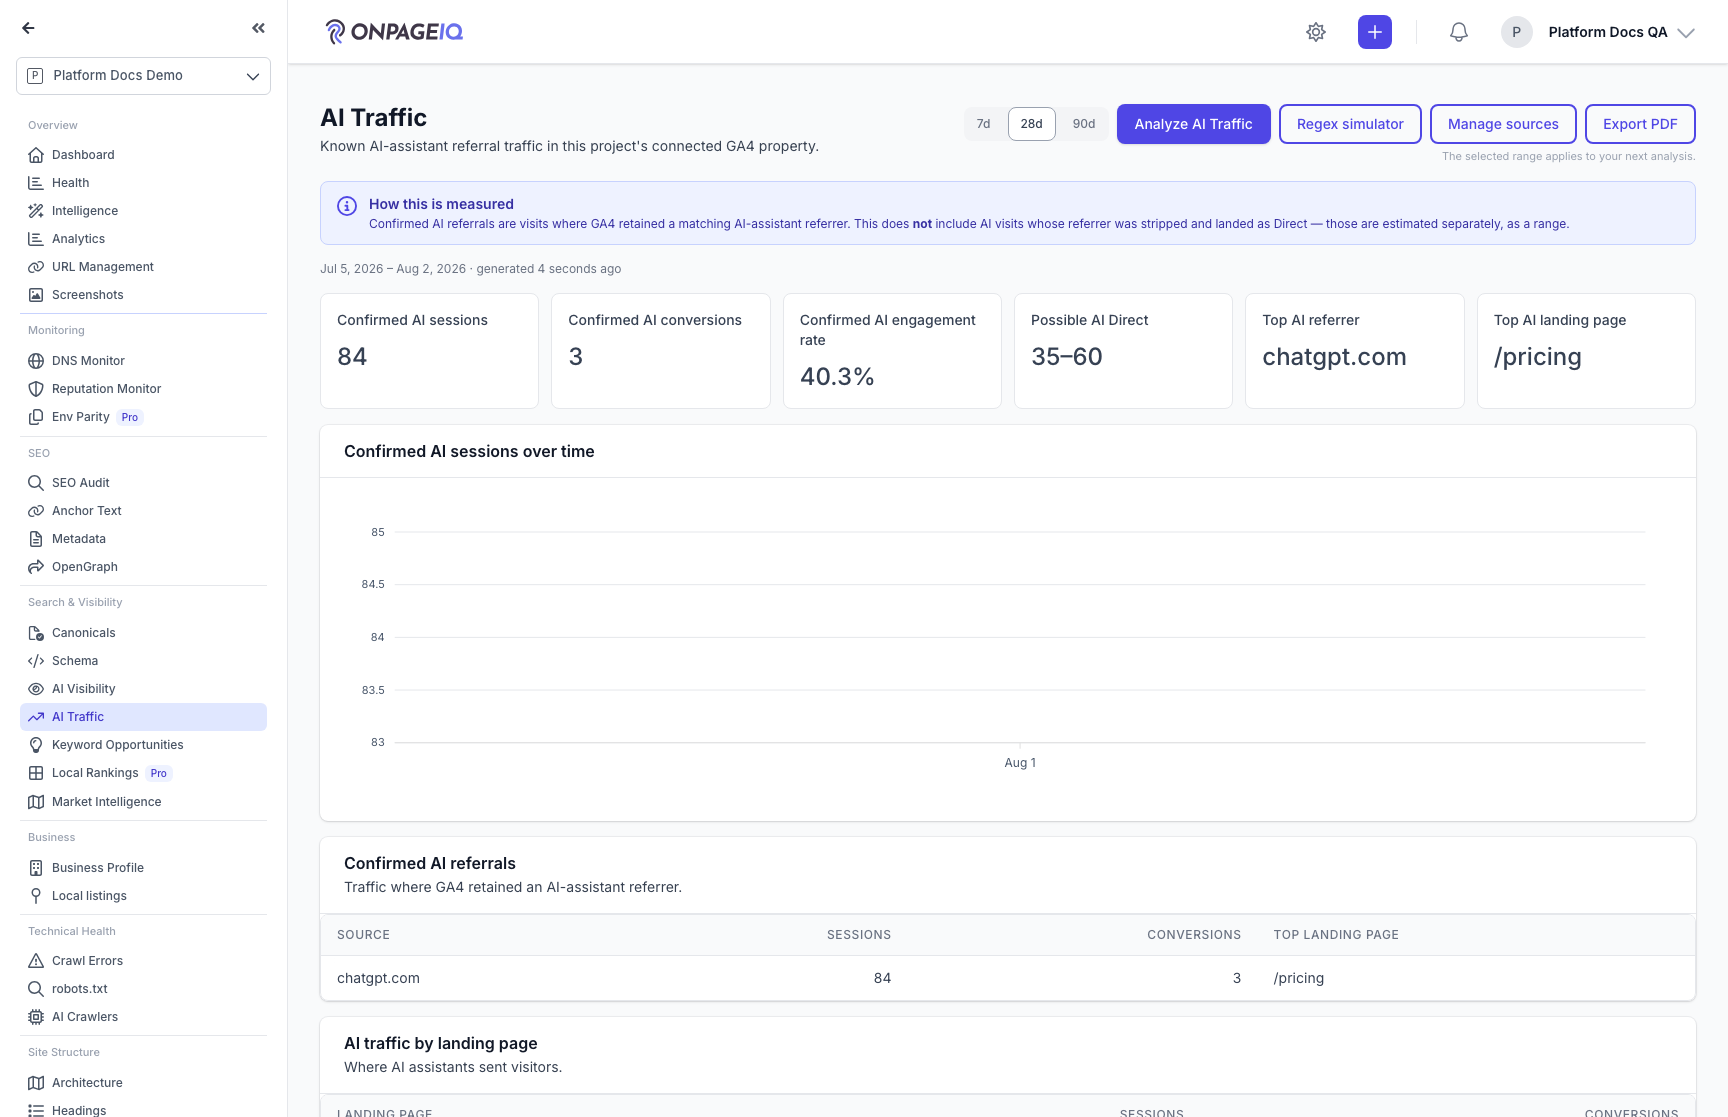
The dashboard headlines the hard numbers: confirmed AI sessions, conversions, engagement rate, and the top AI referrer / landing page. Below, a trend chart shows daily confirmed-AI sessions and a table lists the top landing pages by AI sessions. These counts are host-anchored and exclude organic/cpc/paid mediums, so search traffic is never miscounted as AI.
What to do: Review KPIs → trend chart → top landing pages
Where: projects.ai-traffic
Expected (pass)
- KPIs, trend, and landing-page table reflect only confirmed AI traffic
- google/organic and bing/cpc are excluded even though the host matches an AI token
Negative cases (must fail safely)
- No completed report yet → the panels show an empty/“run an analysis” state, not stale zeros
-
Step 3. Review Possible AI Direct estimates
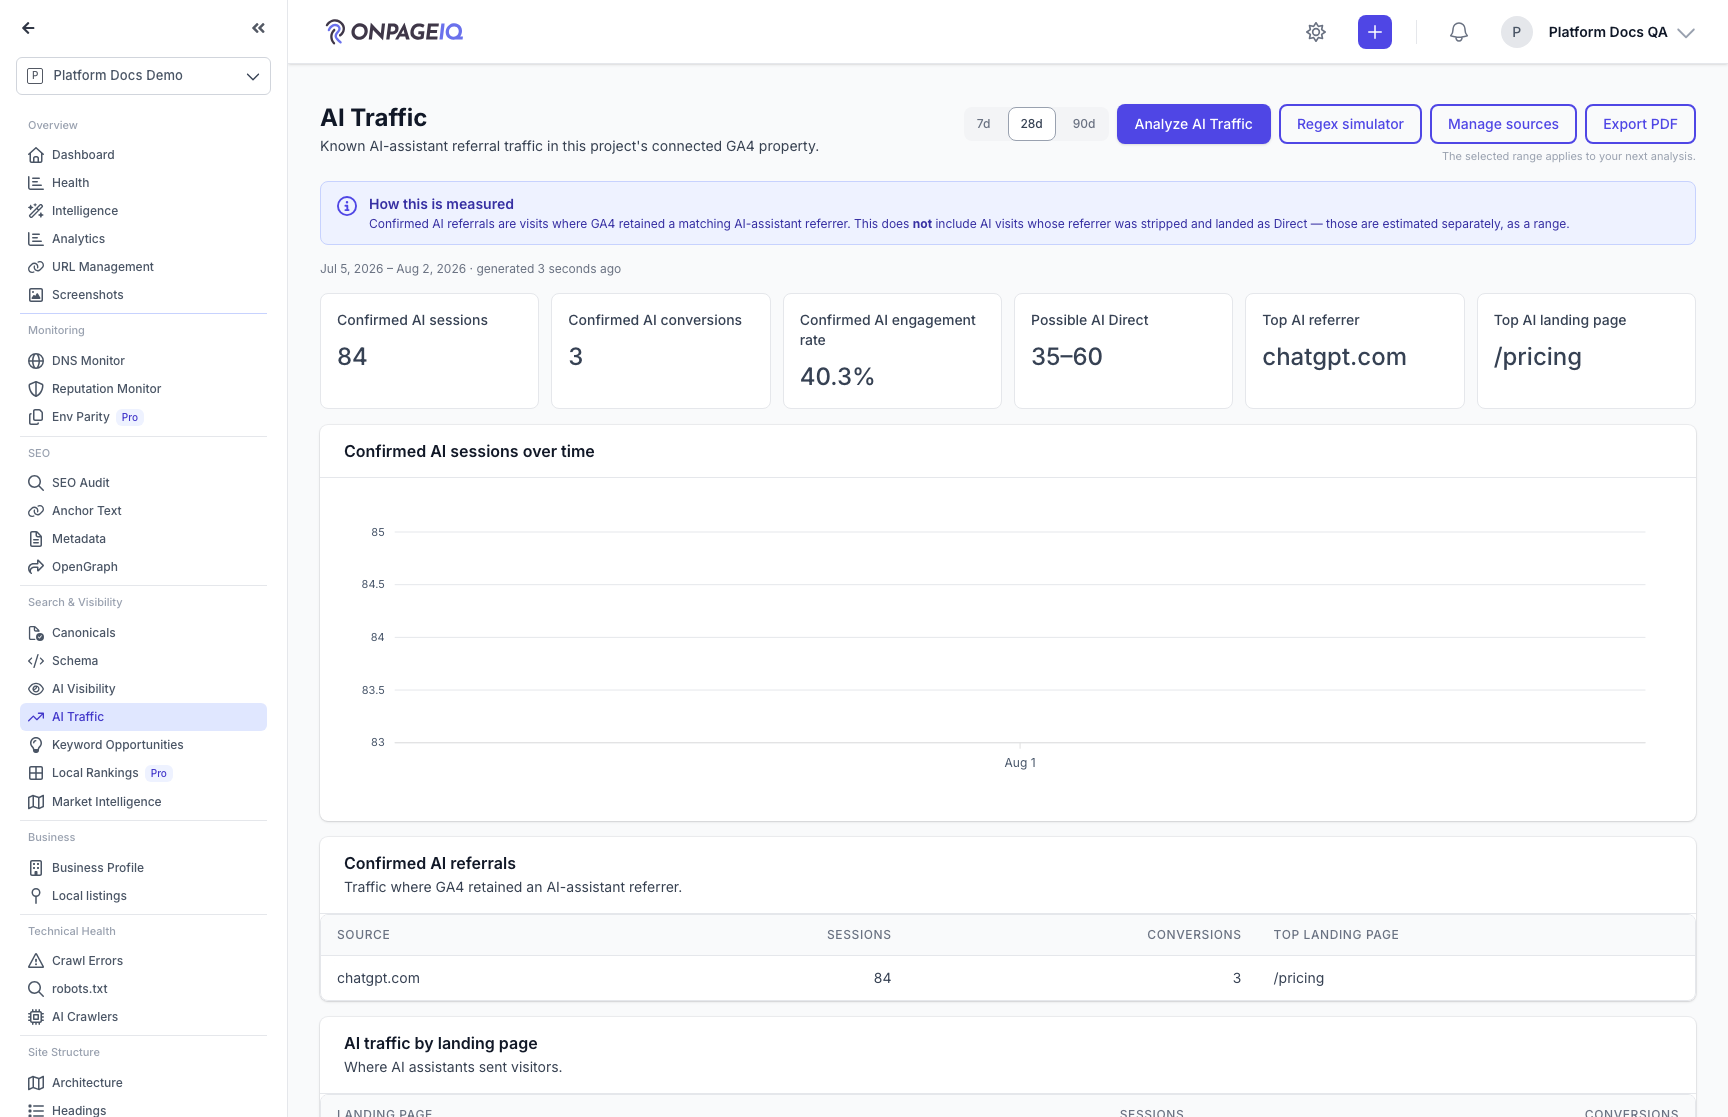
Because many AI clients strip the referrer, some AI-driven visits arrive as Direct. The Possible AI Direct panel estimates those per landing page as a session RANGE with a Low/Medium/High confidence label, derived from a transparent weighted-signal heuristic. It is deliberately separate from the confirmed count — read it as “likely additional AI traffic”, never as a precise figure.
What to do: Open the Possible AI Direct panel → read per-page band + confidence
Where: projects.ai-traffic
Expected (pass)
- Each page shows a min–max session band and a confidence label
- The estimate is presented apart from the confirmed AI numbers, never merged into them
Negative cases (must fail safely)
- No qualifying Direct signals → the panel is empty rather than inventing a number
-
Step 4. Test a regex in the simulator (before GA4)
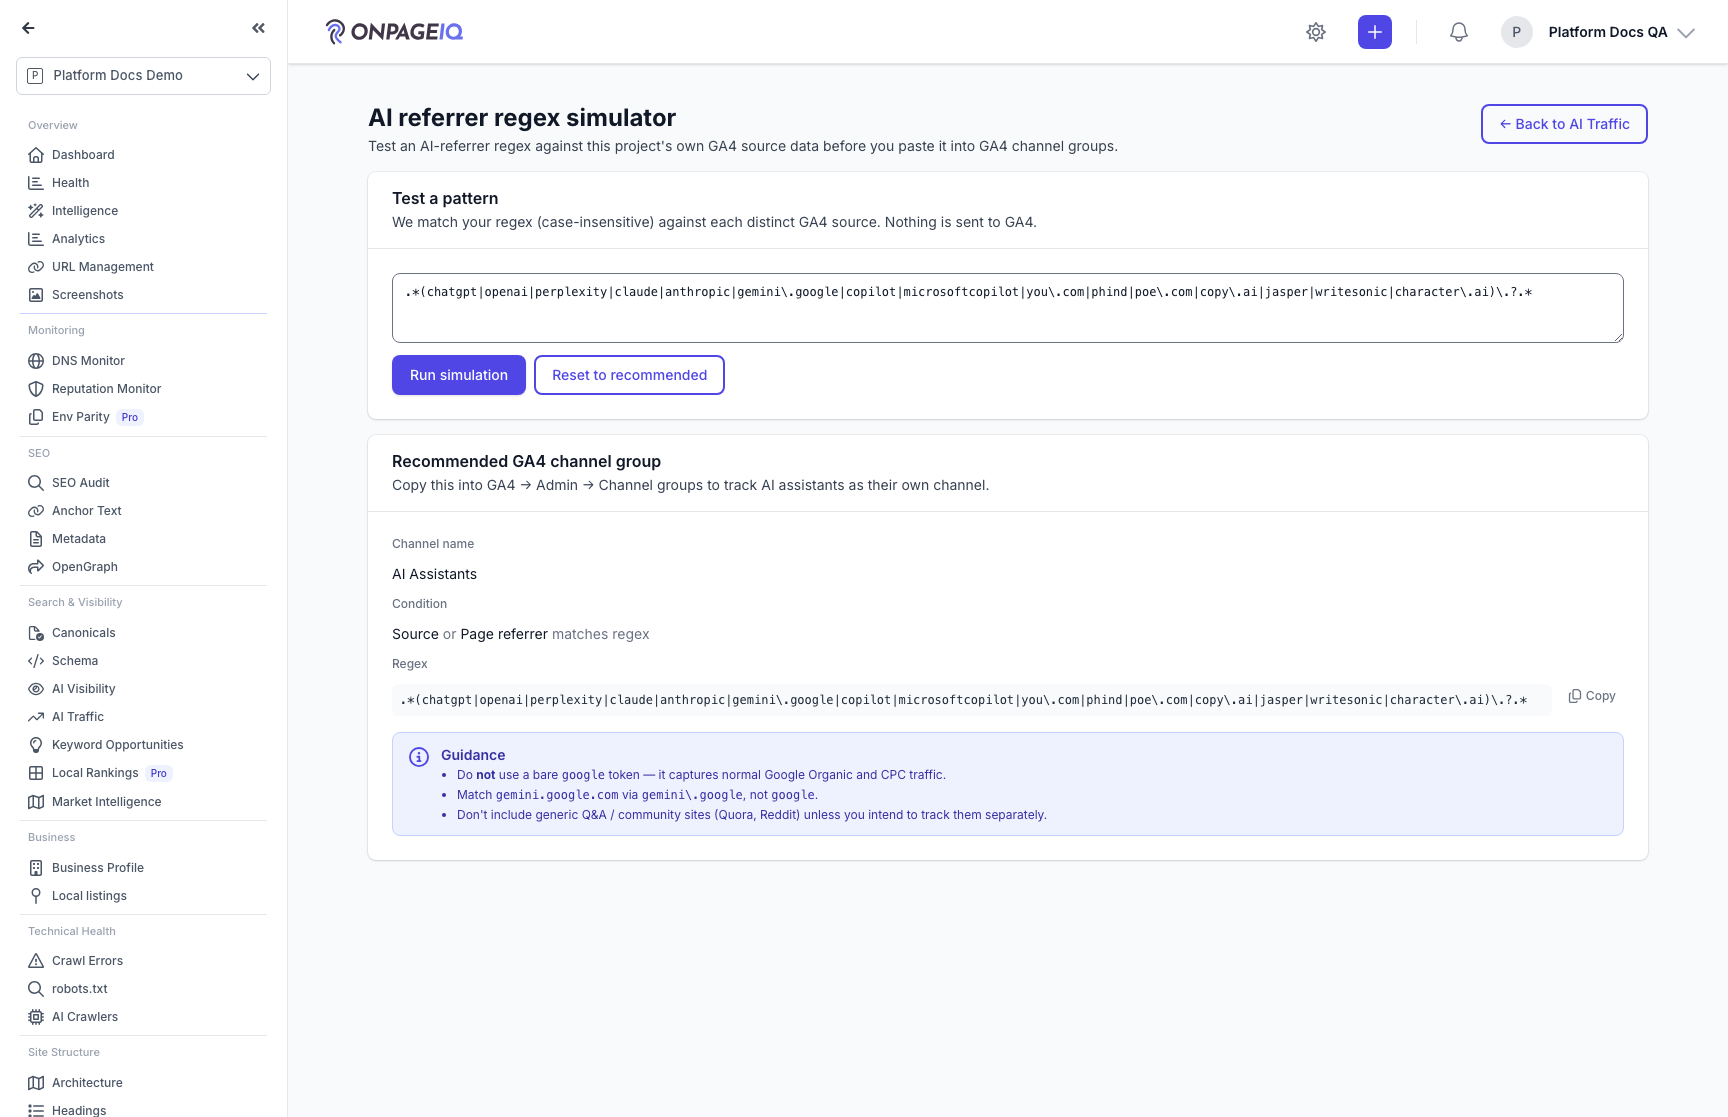
Open the Simulator to test a candidate AI-referrer regex against your own historical GA4 sources before pasting it into a GA4 channel group. It starts from your org’s recommended pattern, shows which sources and sessions it would match, and warns when a pattern would misclassify normal search traffic (e.g. a bare “google”). Step-by-step guidance explains how to add the pattern as a GA4 channel group so future GA4 reporting recognises AI traffic too.
What to do: GET /projects/{project}/ai-traffic/simulator → edit regex → Simulate → follow channel-group guidance
Where: projects.ai-traffic.simulator
Expected (pass)
- Matched sources/sessions update against the project’s own data
- A bare broad token (google/bing/…) raises a “would misclassify normal traffic” warning
- Regex runs under PCRE backtrack/recursion limits — no catastrophic backtracking
Negative cases (must fail safely)
- Invalid or over-broad regex → rejected with a clear error, no simulation
- Opted-in risky-regex alert fires at most once per (project, warning) — repeated testing does not spam admins
-
Step 5. Manage AI source patterns
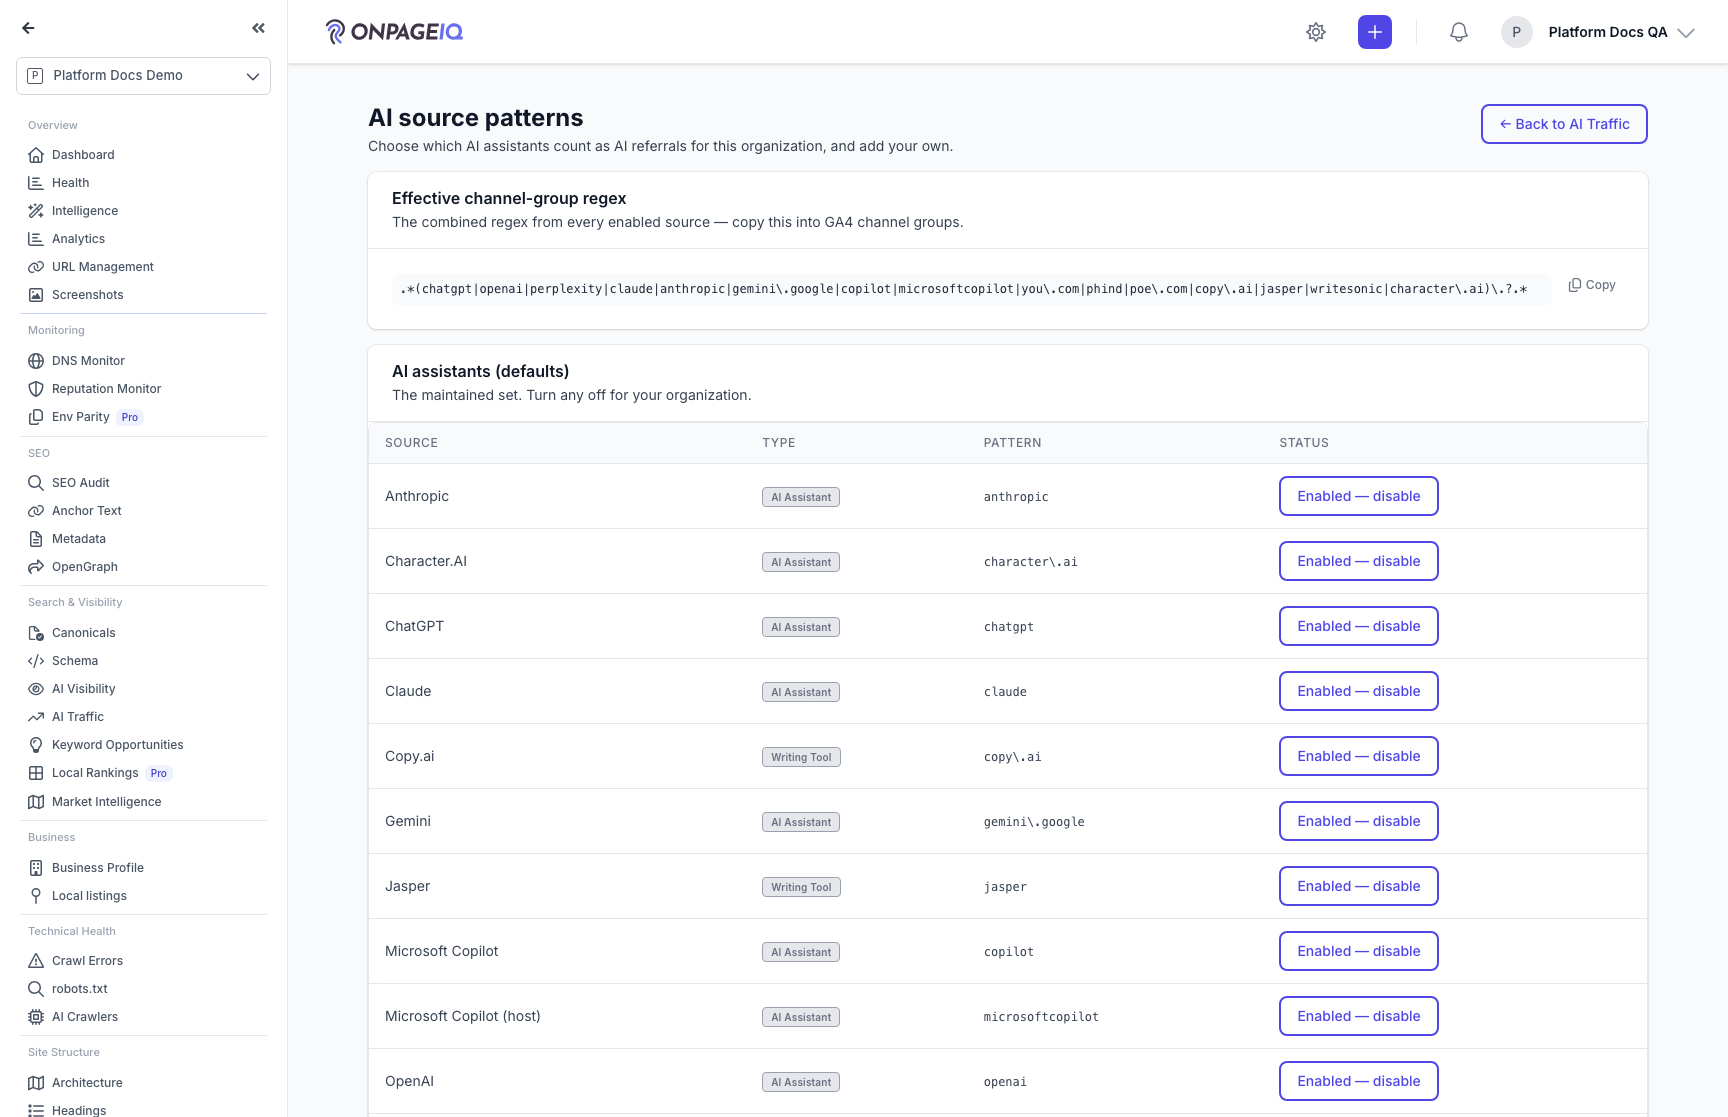
From the Patterns page, add per-org overrides on top of the seeded global default AI-referrer patterns. Each pattern is host-anchored; changes are versioned and org-scoped. This is how you teach the classifier about a new AI assistant that the global defaults do not yet cover.
What to do: GET /projects/{project}/ai-traffic/patterns → add / edit patterns
Where: projects.ai-traffic.patterns
Expected (pass)
- Org overrides layer on top of global defaults; writes require manage_ai_traffic
- Patterns are validated (safe, host-anchored) and scoped to the org
Negative cases (must fail safely)
- Viewer without manage_ai_traffic → pattern editing is hidden / forbidden
-
Step 6. Export a PDF and turn on alerts
Export a branded, client-ready AI Traffic PDF from the dashboard (co-brand header + OnPageIQ footer, confirmed referrals, Possible AI Direct, and landing pages). Optionally enable any of the five alerts in the project’s notification preferences — new AI referrer detected, material change vs the previous report, conversions, a Direct spike, or a risky simulator regex. All alerts are opt-in and default OFF.
What to do: Dashboard → Export PDF; Notification preferences → enable AI Traffic alerts
Where: projects.ai-traffic
Expected (pass)
- Export streams a branded PDF and re-checks view + feature entitlement server-side
- Alerts only send when explicitly opted in; recipients are org-scoped
Negative cases (must fail safely)
- Not entitled / no completed report → export is blocked (403 / 404), not a broken file
Related guides
Market Intelligence
Discover nearby areas with Census demographics, Fit & Opportunity scoring, and a numbered map that matches the table — then send included areas to Keyword Research and AI Visibility.
AI Visibility (LLM Listening)
See how the answer engines describe your brand — overall, per engine, and per place you serve — with the evidence behind every number.