Reading a System Error
Updated · Aug 21, 2026What a system_error audit row tells you, and how to see the real error on a testing environment instead of "Server Error".
What changed
A Livewire refusal now records WHICH component refused, so two components no longer share one incident or one five-minute dedupe window. Signed-in testers on a non-production environment can be shown the full exception page while anonymous visitors keep the generic one.
User goal
Turn "it broke" into a bug report someone can act on.
- Tier
- All testers
- Nav label
- Admin → Audit Logs
- Route
- /admin/audit-logs
- Gates
- —
Prerequisites
- A SuperAdmin account to reach /admin/audit-logs
- For the full error page: OPS_DIAG_DETAILED_ERRORS_FOR_AUTHENTICATED=true on that environment, with APP_DEBUG still false
QA focus
- Quote the component and method from the row, not just "a Livewire error"
- Check whether an incident is already acknowledged before filing a duplicate
- Never enable detailed errors on an environment with customer accounts
Overview
When something 500s, two records exist: the audit row an operator reads, and the page you saw.
What you get
- A
system_erroraudit row carrying the exception class, the message, the request URL, your user and IP, and — for a Livewire failure — the component that refused and the method it was asked for - Incidents grouped per component, so acknowledging one does not silence another
- Optionally, the real exception on screen instead of "Server Error"
How it works
- Every unhandled 500 writes one audit row, deduped to one per error per five minutes so a repeated fault does not flood the log
- A Livewire "method not found" names the component, which is what makes two different broken surfaces two different incidents rather than one
- Detailed errors are decided per environment and per request: a signed-in session sees them, an anonymous visitor never does, and production never does regardless of configuration
Common issues & false alarms
- No row for an error you just saw → it deduped against an identical error in the last five minutes
- livewire_component missing on a Livewire failure → the request did not reach a component (payload rejected before dispatch)
- Still seeing "Server Error" while signed in → the setting is per environment and needs a redeploy to take effect (config:cache)
Interactive guide
Step of
What to do
Where to find it
Expected (pass)
Negative cases
Tips
Screenshot pending capture
All steps (reference)
-
Step 1. Find the error
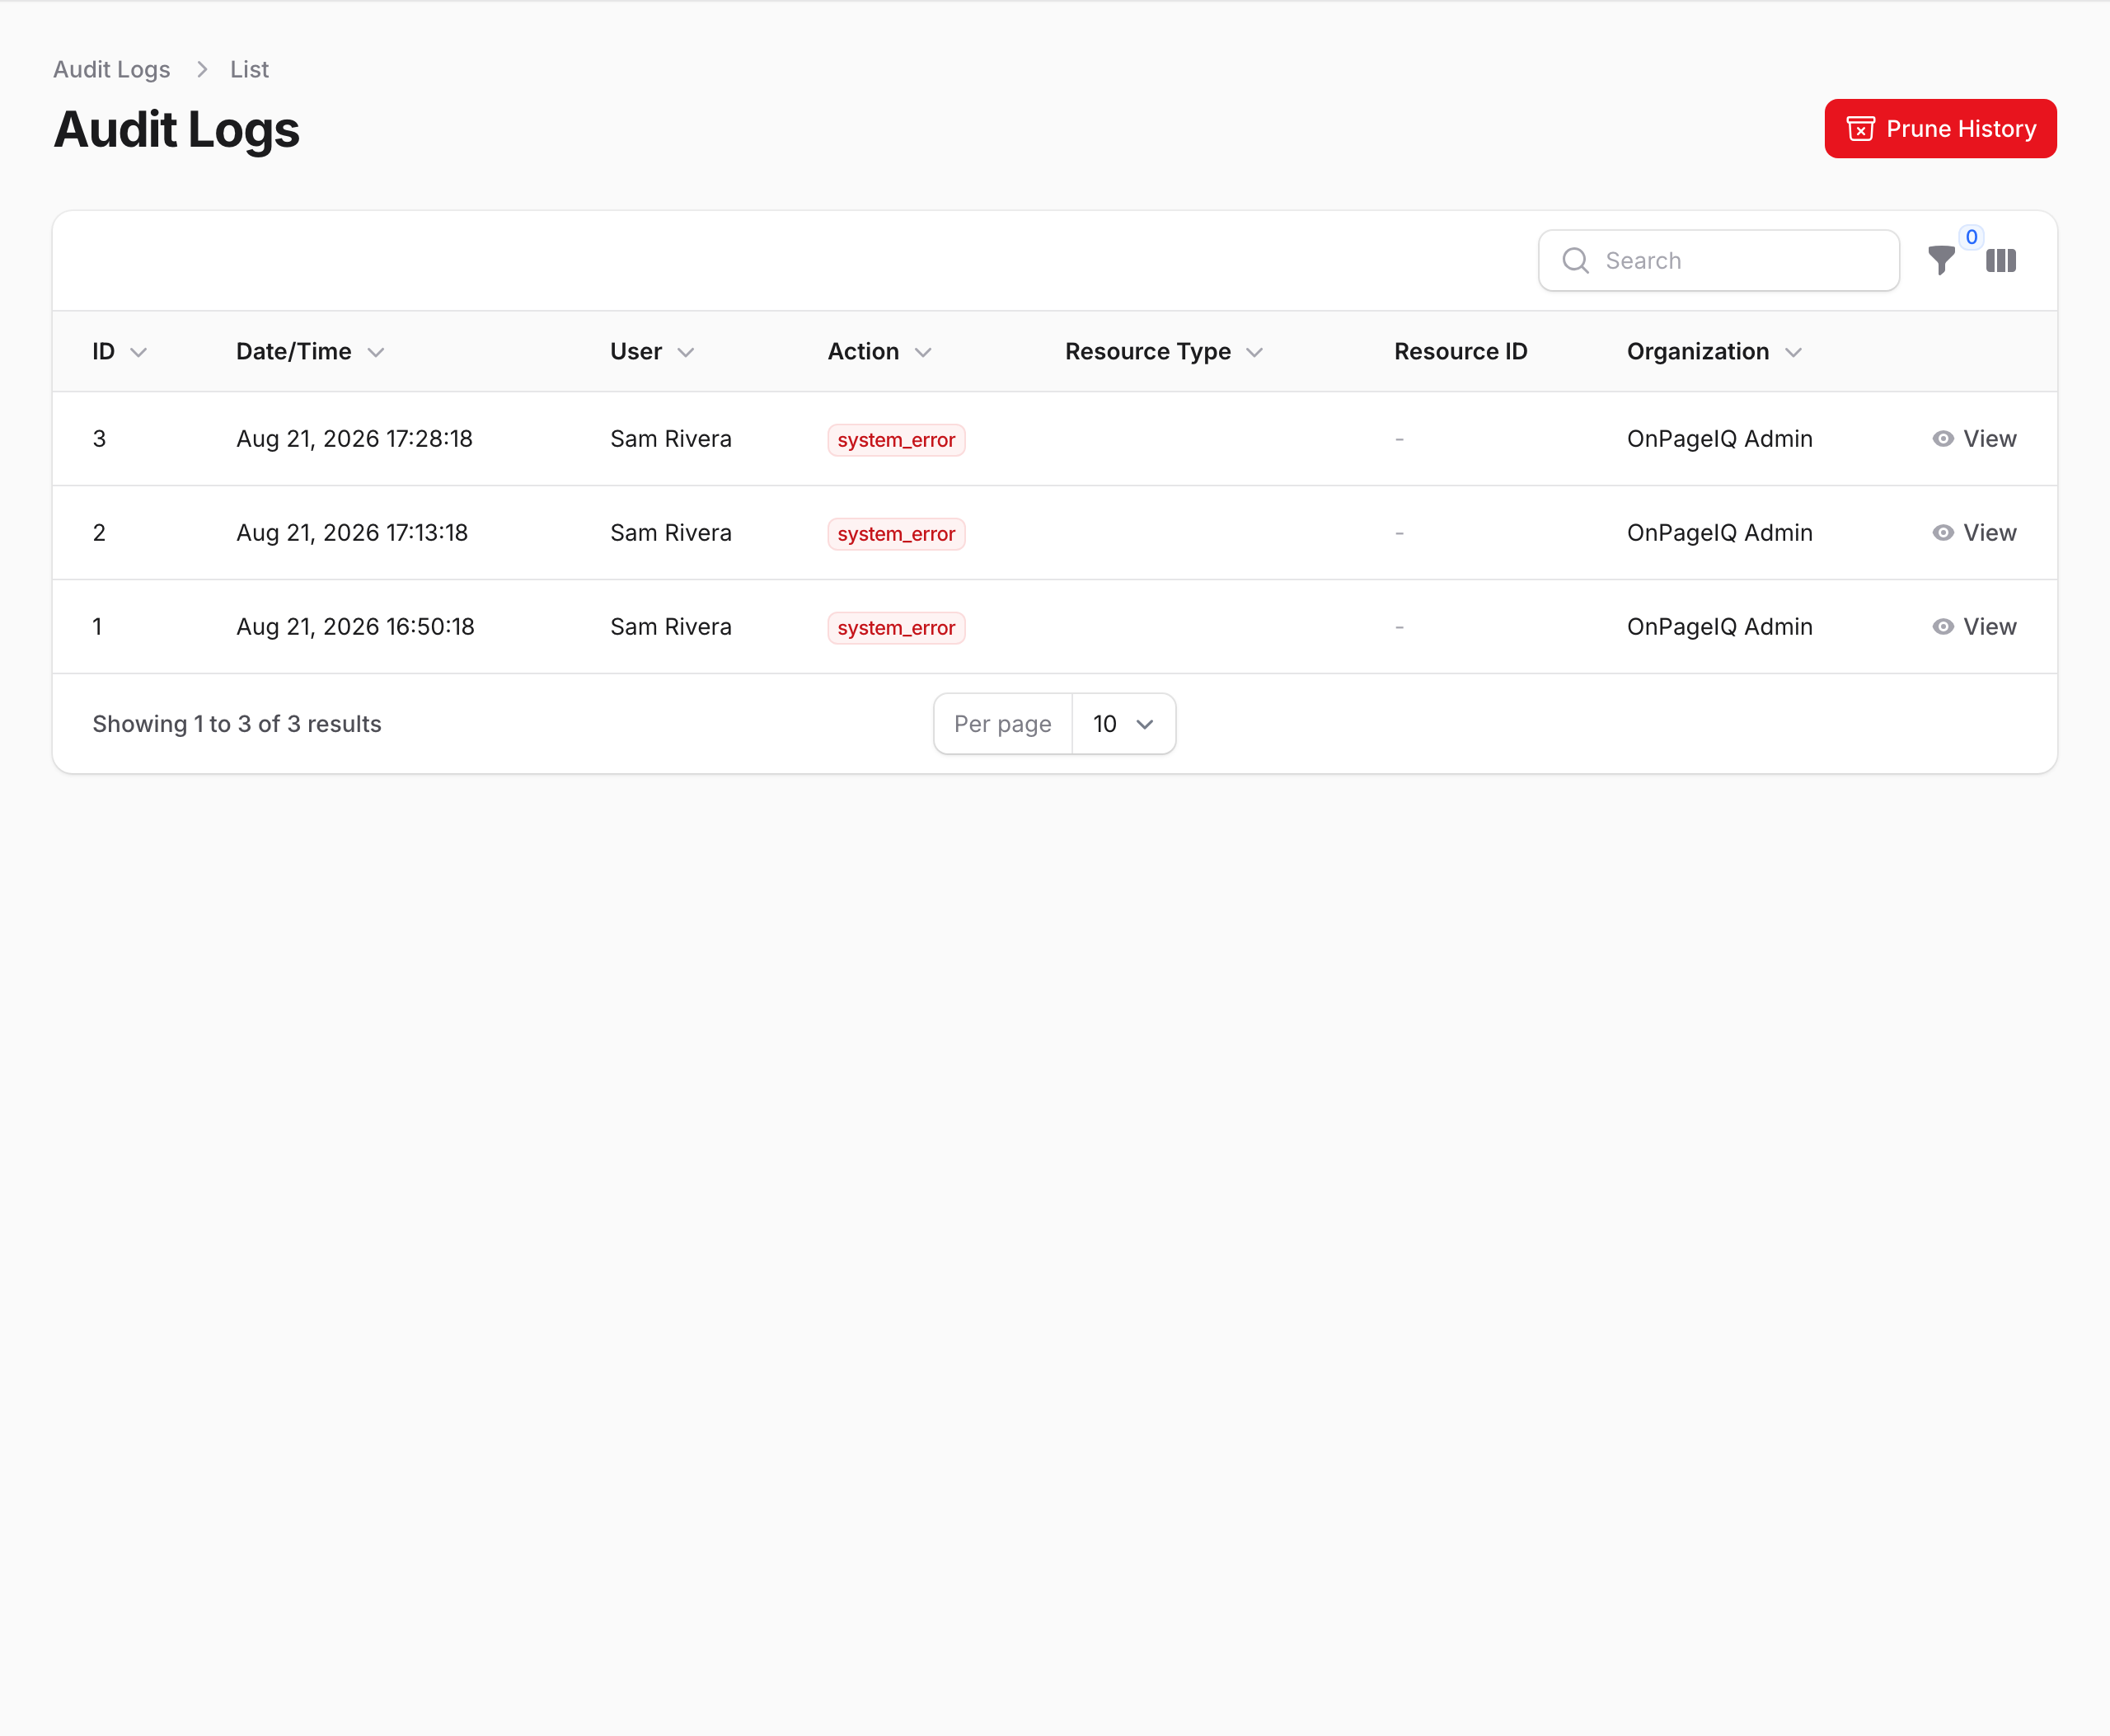
Open the audit log and filter to system errors. Newest first.
What to do: Admin → Audit Logs → Filter → Action = System Error
Where: /admin/audit-logs
Expected (pass)
- Rows show date, user, action, and organization
- Filtering to System Error hides routine activity like dashboard_viewed
Tips
- One click can write more than one row: the error, plus anything that failed while rendering it.
-
Step 2. Read the row
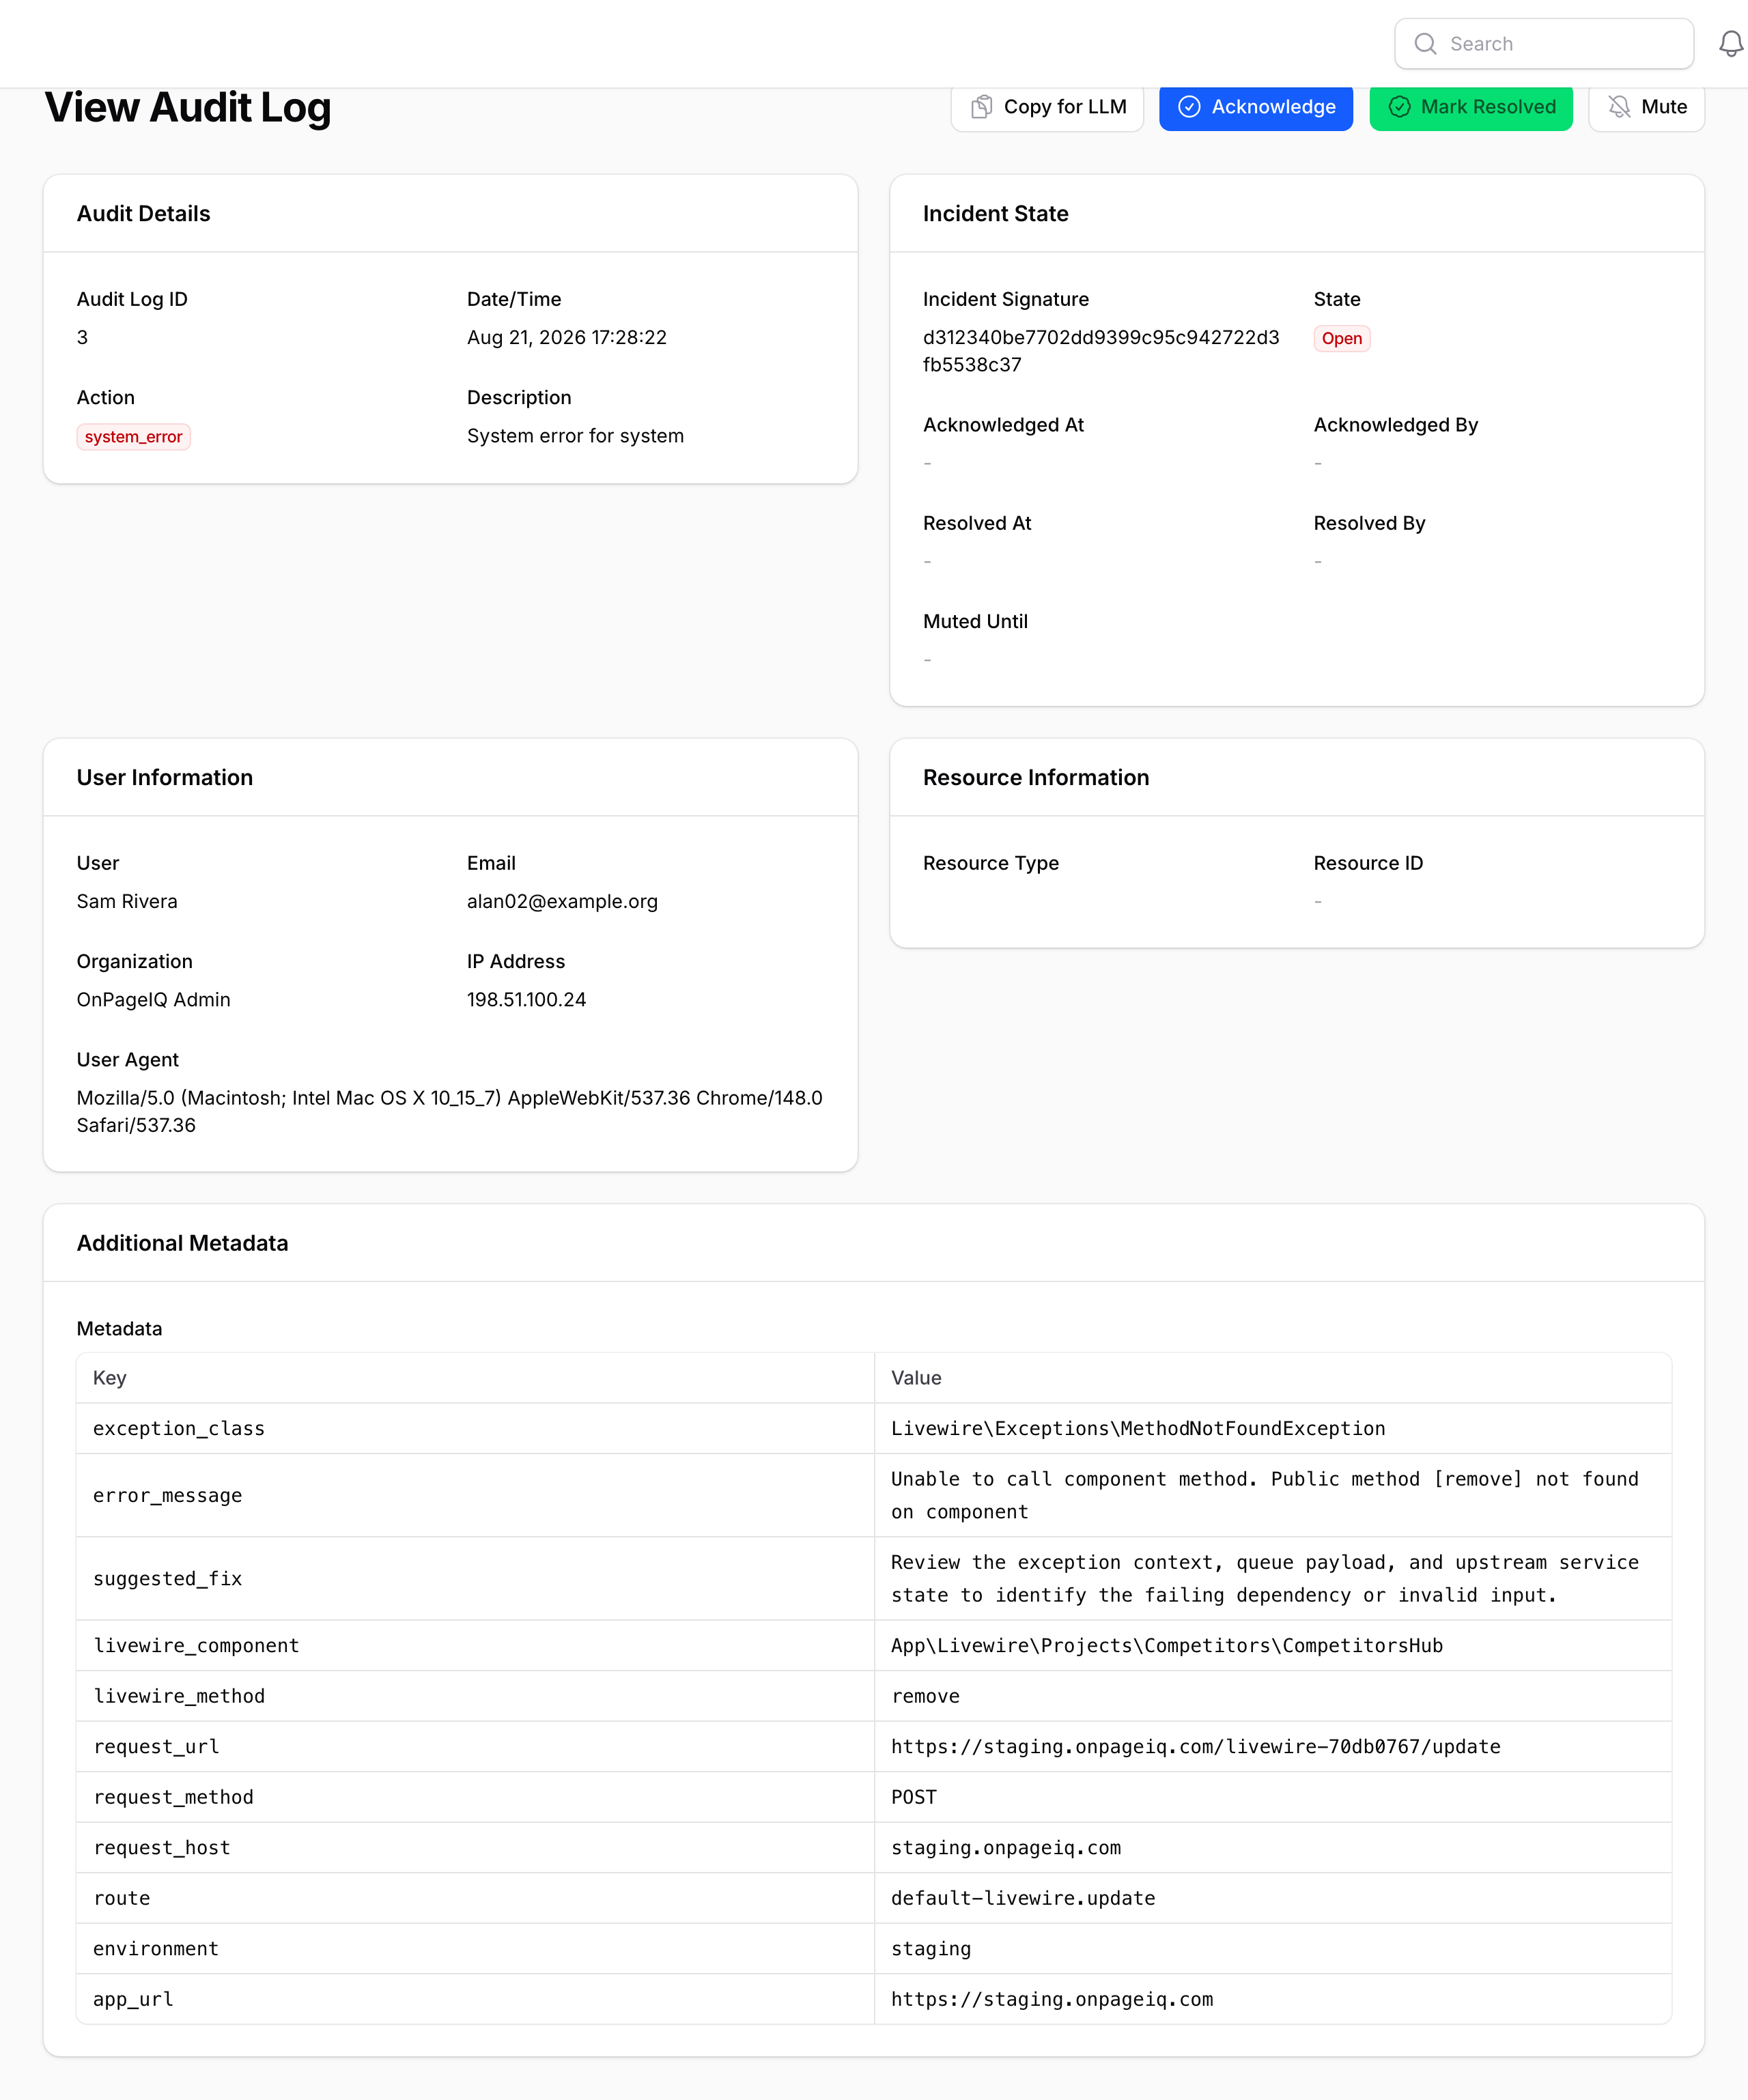
Open a row. Everything worth quoting in a bug report is under Additional Metadata.
What to do: Click View on a system_error row
Where: /admin/audit-logs/{id}
Expected (pass)
- exception_class and error_message identify the fault
- request_url, IP and user agent identify the request
- For a Livewire failure: livewire_component names the class that refused, and livewire_method the method it was asked for
- Incident State shows Open, Acknowledged, Resolved or Muted — repeat faults collapse into one incident, so look before filing a duplicate
- Two different components produce two incidents, so acknowledging one leaves the other visible
Negative cases (must fail safely)
- livewire_component absent on a non-Livewire error — expected, not a bug
Tips
- Copy for LLM puts the whole row on your clipboard as Markdown.
-
Step 3. See the real error on screen
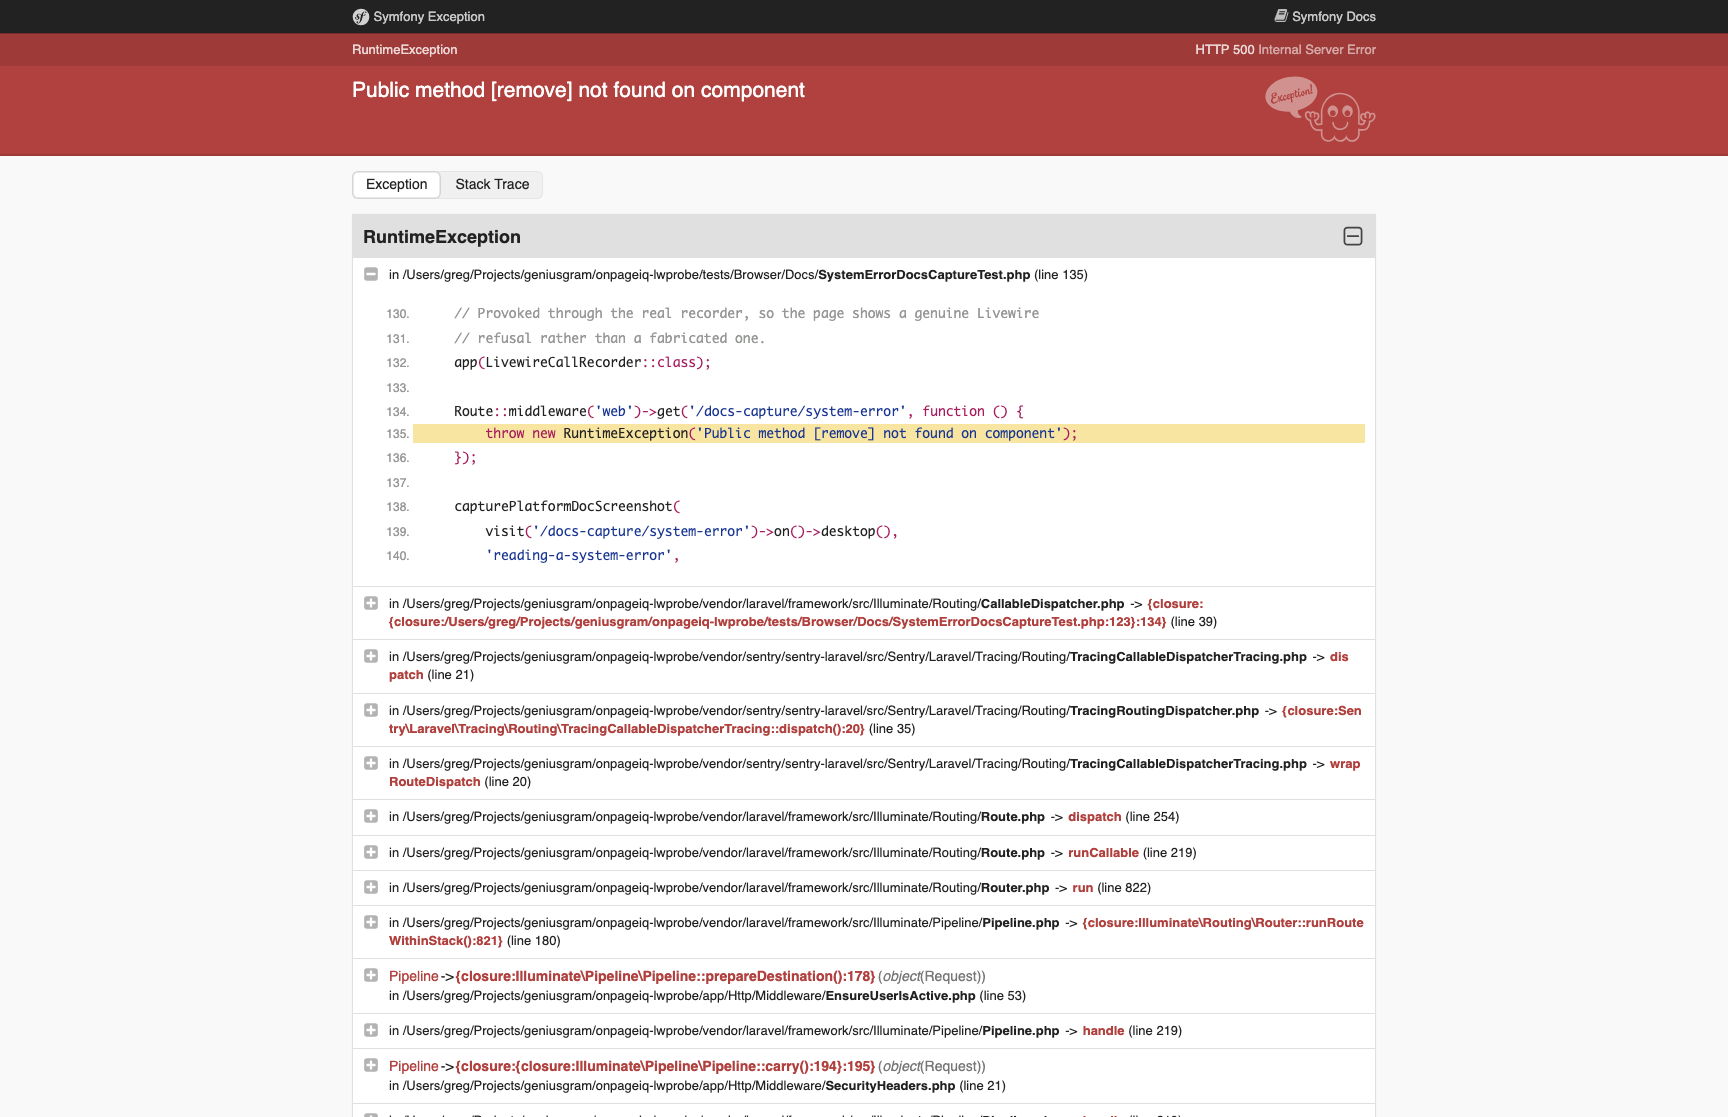
On a testing environment, a signed-in tester can be shown the full exception page. Anonymous visitors keep the generic one.
What to do: Set OPS_DIAG_DETAILED_ERRORS_FOR_AUTHENTICATED=true and redeploy; keep APP_DEBUG=false
Expected (pass)
- Signed in: exception class, message, stack trace and source
- Signed out: the plain "Server Error" page
- Production: the plain page, whatever the setting says
Negative cases (must fail safely)
- An API token is not a signed-in session — token requests keep the generic response
Tips
- The page shows every stack frame ARGUMENT, so a database error displays its query bindings. Anyone who can sign in to that environment can read them. Do not enable it anywhere with customer accounts.