Project Health
Updated · Aug 27, 2026One composite health score for the project, its four domain sub-scores, what changed since last time, and what to fix next.
What changed
Two additions. Where part of a score movement was caused by a change WE made — content scoring was pinned on 24 August 2026, which moved every score once — the Health page, the alert email and the in-app notification all say so instead of letting it read as a change to your site. It appears only when a page was actually re-scored across that date, so a project sitting untouched either side of it is not told that something moved. Separately, Health Score history is now trimmed to your plan's retention window each night; a project is never left with no score at all, whatever its age. Earlier: the bars in the project dashboard's 12-day trend are now clickable. Clicking one opens the Health page for that day — the score, the four domain sub-scores, coverage, and what was fixed or regressed at that point, exactly as they were saved. A banner marks the page as a past day and offers a link back to today. "What to fix next" is deliberately not shown on a past day: that list is worked out from your site as it is now, so beside an old score it would describe fixes that were not the fixes for that day.
User goal
Answer "is this site getting better or worse?" without reading five separate dashboards.
- Tier
- Any plan
- Nav label
- Health
- Route
- /projects/{project}/health
- Gates
- —
Prerequisites
- At least one completed scan or audit so a health snapshot exists
- More than one snapshot before the trend is meaningful
QA focus
- The page READS the latest persisted snapshot — it never recomputes on render, so the number must not drift between refreshes
- Recommendations are the one live computation and must deep-link to the subsystem page where the fix is made (internal named routes only)
- Coverage is stated honestly: a domain with no data is reported as missing, not scored as zero
- A trend bar deep-links to ?snapshot={id}; the page renders THAT snapshot, not the latest, and the banner names its date
- A snapshot id belonging to another project or another organization is a 404, not another org's score — same for a malformed or out-of-range id
- The live "what to fix next" list is suppressed on a past snapshot, because it is computed from current findings
Overview
Project Health rolls the project’s subsystems into one composite score so you can answer “is this site getting better or worse?” without reading five separate dashboards.
What you get
- A headline composite score with four domain sub-scores
- Coverage — how much of the site the score is actually based on
- Fixed and regressed callouts since the previous snapshot
- A prioritized what to fix next list that deep-links to the page where each fix is made
- A trend across recent snapshots (needs more than one snapshot)
- A clickable trend — click any bar in the project dashboard's 12-day trend to reopen the Health page as it was on that day
How it works
- The page reads the latest persisted snapshot — it does not recalculate on every refresh
- Domains with no data show as missing, not as a zero score
- Run a scan or audit to refresh a stale score; follow recommendation links into the subsystem that owns the fix
When part of a change is ours
Sometimes a score moves because we changed how something is measured, not because your site changed. When that is the case the page says so plainly, above the per-area breakdown, and the same sentence appears in the alert email and the notification bell.
The one on record: content scoring was pinned on 24 August 2026, which moved every score once. The note appears only when a page was genuinely re-scored across that date — a project left untouched either side of it is not told that something moved, because nothing did.
How long history is kept
Snapshots are trimmed each night to your plan's history window. Paid plans keep their full history. Whatever the plan and however old it is, the most recent snapshot is always kept — a quiet project's Health page never empties out because a cleanup job ran.
Looking at a past day
Each bar in the trend is a saved snapshot. Clicking one opens /projects/{project}/health?snapshot={id} — the same page, reading that saved snapshot instead of the newest one. Nothing is recalculated, so the numbers are exactly what they were.
A banner names the day you are looking at and links back to today. What to fix next is not shown on a past day. That list is worked out from your site as it is now, so putting it beside a two-week-old score would claim those were that day's fixes.
Common issues & false alarms
- Score looks stale → it reflects the last completed scan/audit; run one to refresh it
- A domain shows as missing rather than scored → nothing has produced data for that domain yet
- No trend yet → a trend needs more than one snapshot
- A saved link to a past day now shows "not found" → that snapshot belongs to a different project, or the address was edited by hand
- No "what to fix next" on the page → you are on a past day; use "Back to today"
- The bar you arrived from is not outlined → the trend shows the 12 most recent snapshots, and that day has since dropped off the end
- The score moved but nothing on the site changed → look for the note saying part of the movement is ours; it names the date the scoring changed
- Older snapshots have disappeared from the trend → history is trimmed to your plan's window each night; the newest snapshot is always kept
Interactive guide
Step of
What to do
Where to find it
Expected (pass)
Negative cases
Tips
Screenshot pending capture
All steps (reference)
-
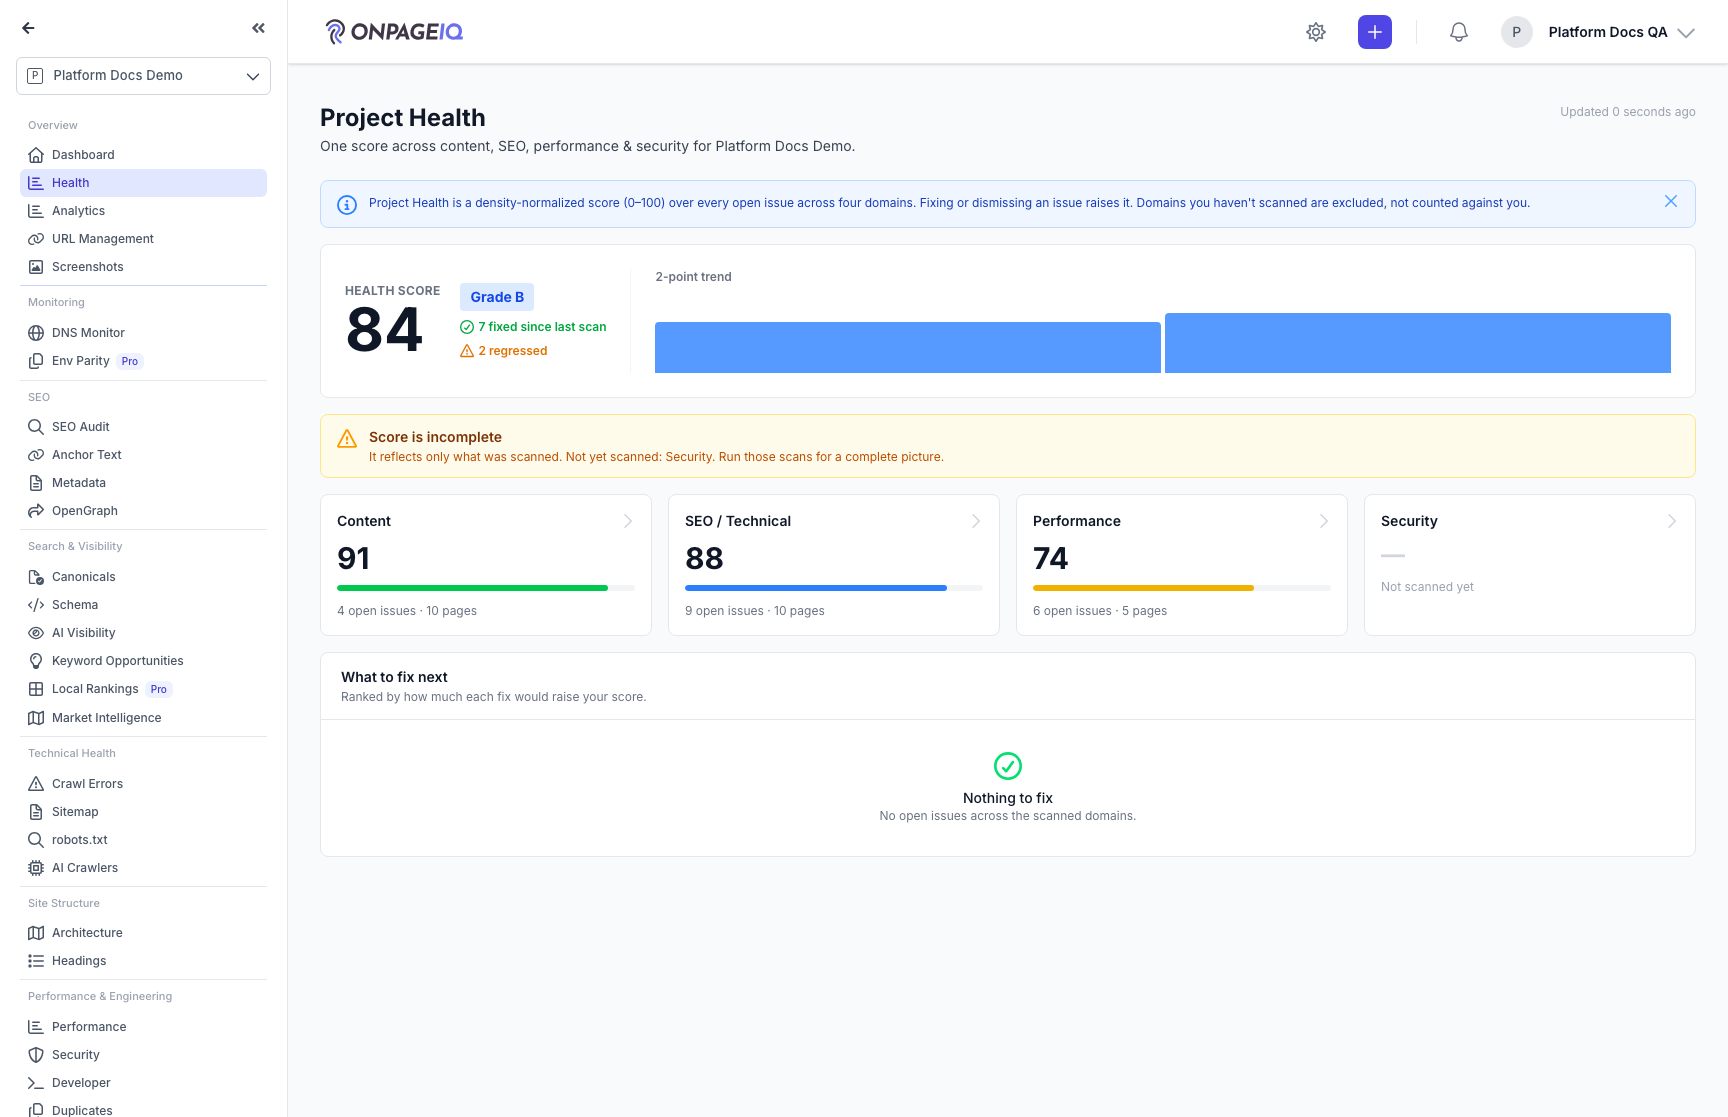
Step 1. Read the composite score and its domains
The headline score sits above four domain sub-scores, with coverage telling you how much of the site it is based on. A low coverage number matters as much as a high score — it says the score is based on little.
What to do: Project → Health.
Where: projects.health
Expected (pass)
- Composite score, four domain sub-scores, and coverage all render
- The score matches the latest snapshot and does not change on refresh
- A domain with no data reads as missing, not as a zero score
Negative cases (must fail safely)
- No snapshot yet → an empty state explaining a scan is needed, not a fabricated score
-
Step 2. See what changed, then fix the next thing
Fixed and regressed callouts compare this snapshot against the previous one, and "what to fix next" ranks the highest-value work. Each recommendation links directly to the subsystem page where that fix is actually made.
What to do: Health → read the fixed/regressed callouts → follow a recommendation link.
Where: projects.health
Expected (pass)
- Callouts reflect the delta against the previous snapshot
- Each recommendation deep-links to the relevant subsystem page
Negative cases (must fail safely)
- Only one snapshot exists → no delta is claimed rather than everything reading as newly fixed
-
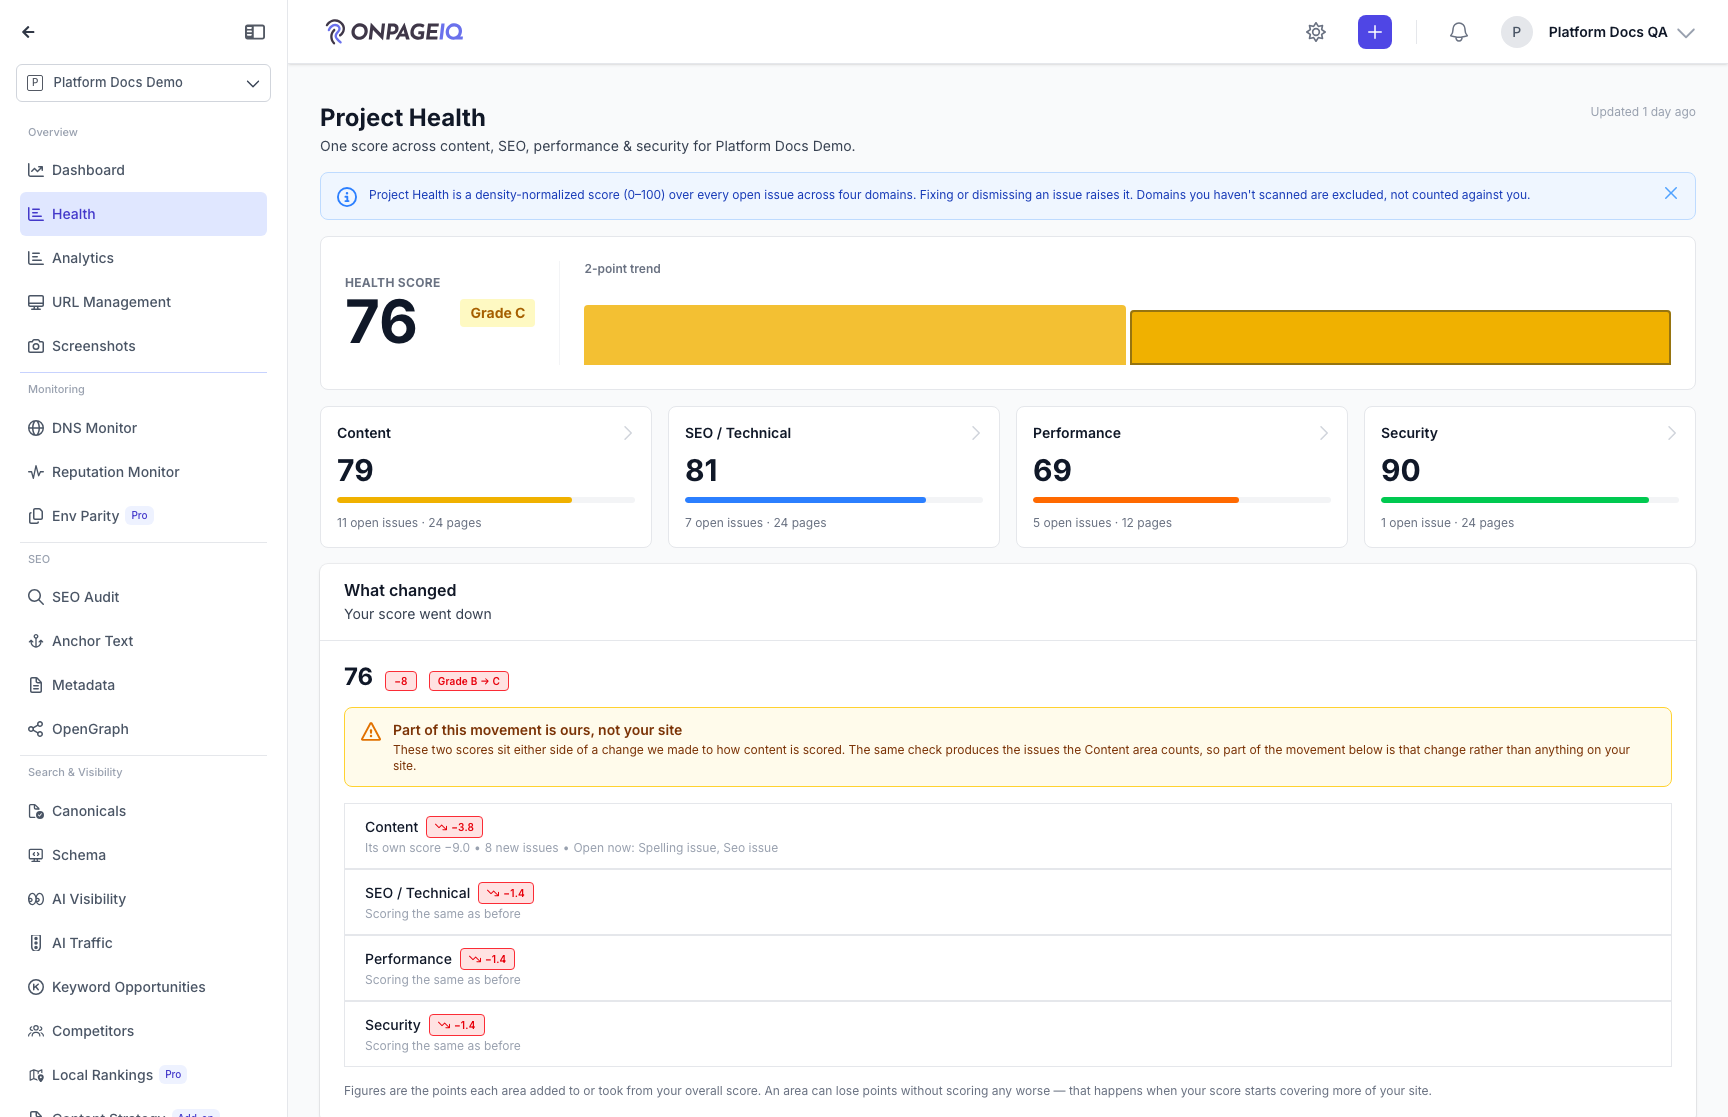
Step 3. Read a change that was partly ours
When a movement is partly caused by a change we made to how something is measured, the page says so above the per-area breakdown rather than letting the numbers imply your site got worse. The same sentence goes into the alert email and the notification bell, so someone who reads only the email is not left with the unqualified version.
What to do: Project → Health, on a project re-scored either side of a scoring change.
Where: projects.health
Expected (pass)
- The notice sits above the per-area breakdown, not below it
- It appears only when a page was actually re-scored across the change date
- A project with no movement at all is not told that part of the movement was ours
Negative cases (must fail safely)
- Both snapshots scored after the change → no notice, because nothing spans it
-
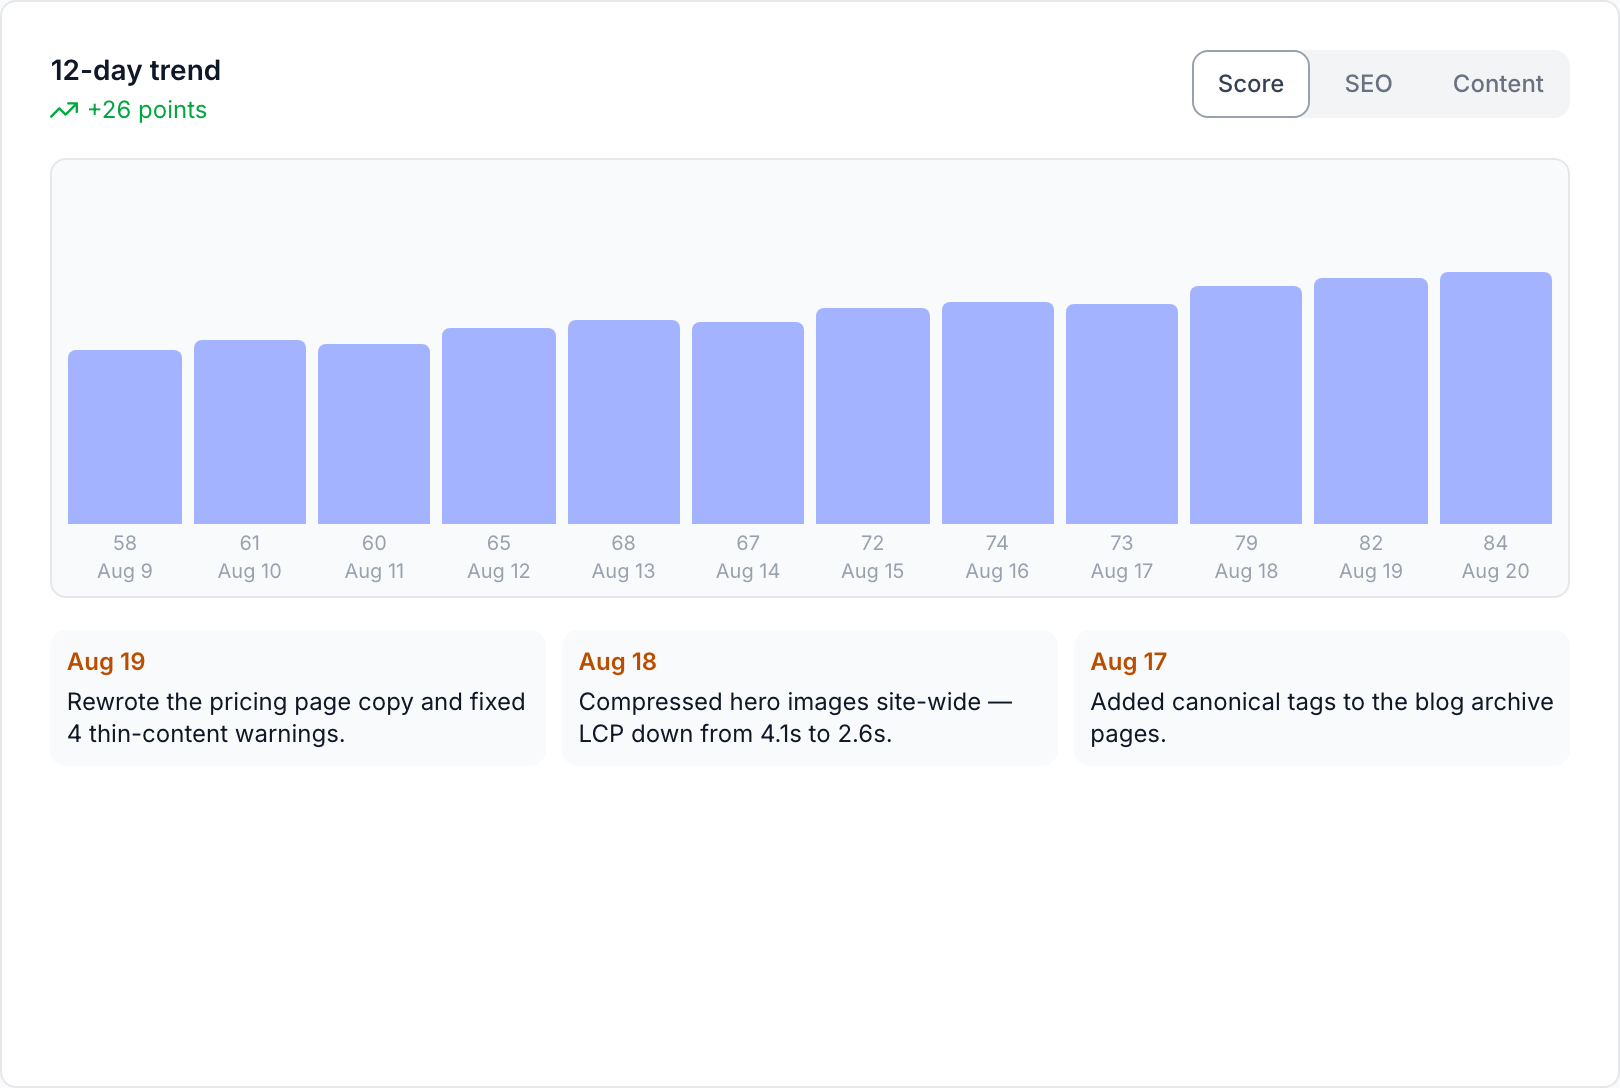
Step 4. Click a bar in the 12-day trend
Every bar in the project dashboard's trend is a saved snapshot of one day, and every bar is a link. Hovering names the day and its score; clicking opens the Health page as it stood on that day. Use the Score / SEO / Content control above the chart to pick which number the bars plot — the link is the same either way.
What to do: Project → Dashboard → click a bar in the 12-day trend.
Where: projects.show
Expected (pass)
- Each bar is a link to the Health page carrying that day's snapshot id
- Hover and keyboard focus both show the bar is interactive, and the label names the date and value
Negative cases (must fail safely)
- No snapshots yet → the card reads "No scan data yet" rather than rendering empty bars
-
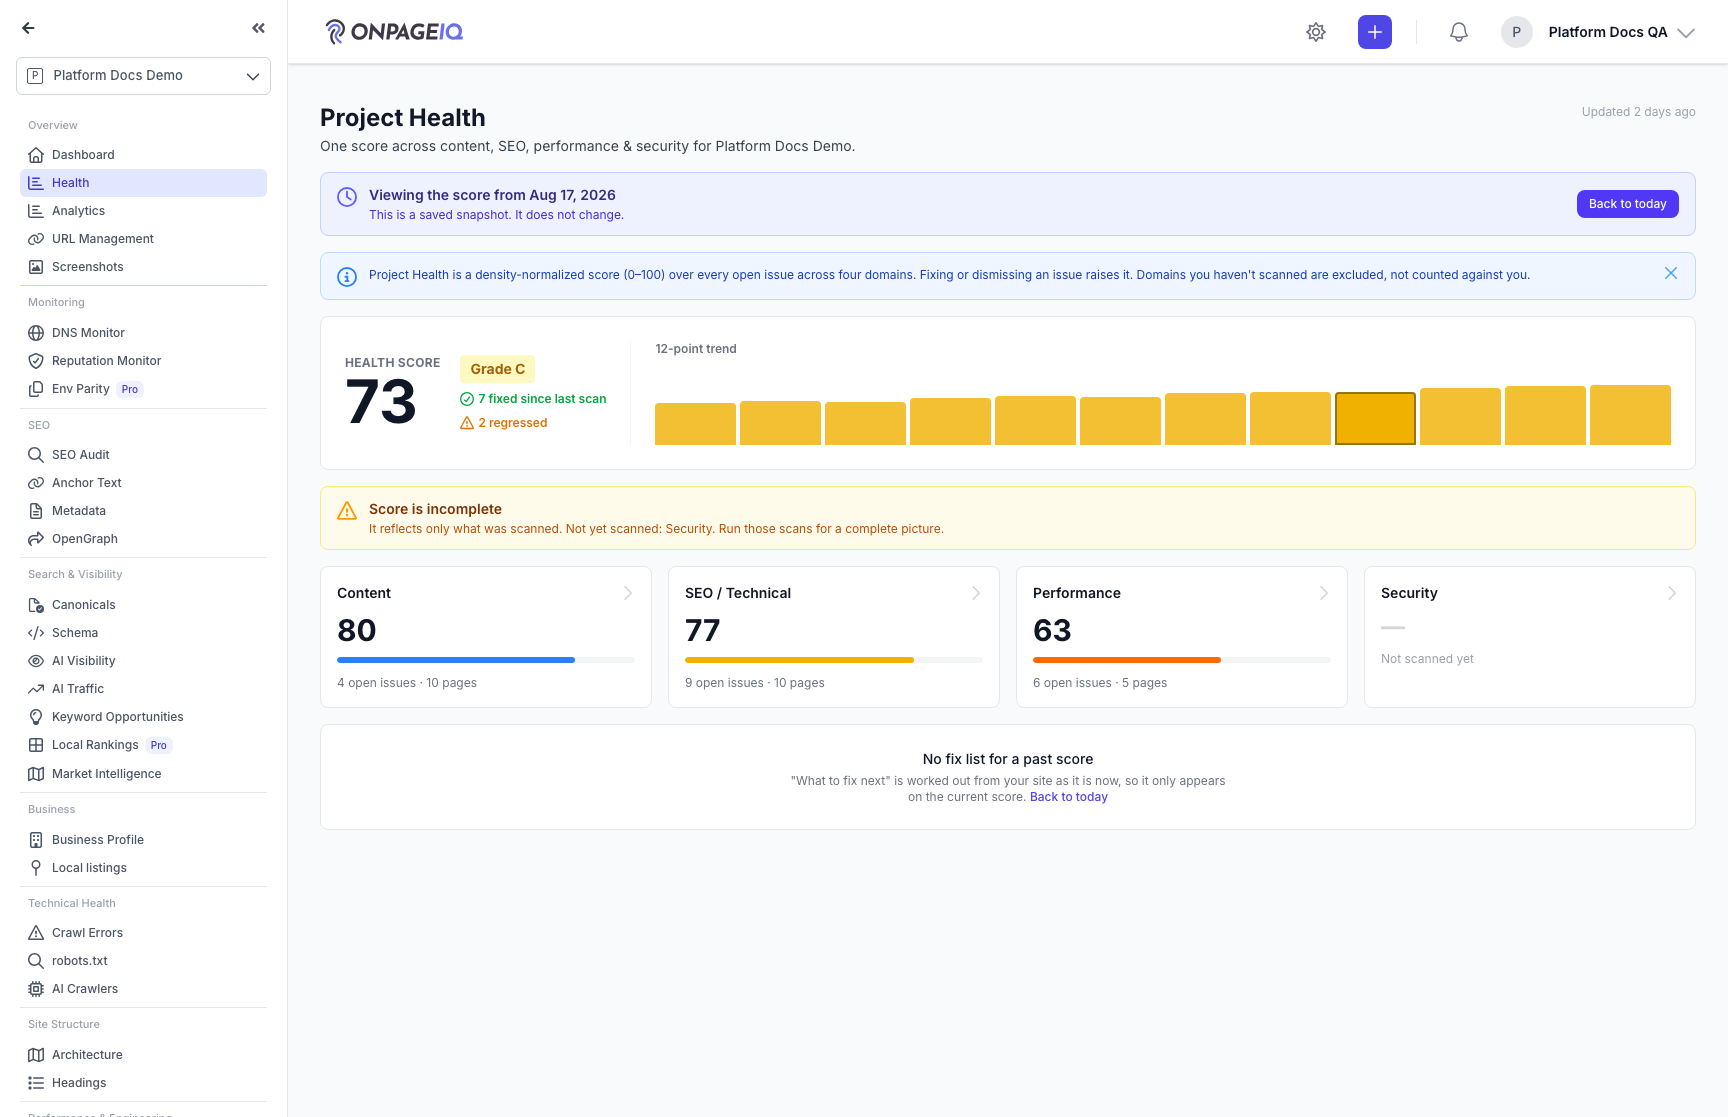
Step 5. Read a past day, then come back
The Health page opens on the day you clicked. Score, domain sub-scores, coverage, and the fixed/regressed callouts are all that day's saved values — nothing is recomputed, so refreshing does not move them. A banner names the day and links back to today, and the trend strip outlines the point you are viewing. "What to fix next" is replaced by a short note, because that list is computed from your site as it is now.
What to do: Health → read the banner → follow "Back to today" when you are done.
Where: projects.health
Expected (pass)
- The banner names the snapshot's date and offers "Back to today"
- The numbers are that snapshot's, not the latest snapshot's
- The fix list is replaced by a note explaining why it only appears on the current score
Negative cases (must fail safely)
- A snapshot id from another project or organization → 404, not another org's score
- A malformed or out-of-range id in the address → 404, not an error page
Related guides
Projects & URLs
Manage projects, URL inventory, tags, and page-level detail.
SEO Audit
Site-wide SEO audit dashboard with crawl status, scores, and deep-dive sub-routes.
Performance Insights
Core Web Vitals and performance metrics from crawled pages.
Security Dashboard
One page for the security of a site: a graded score, a prioritised "what to fix" list, and continuous Google Safe Browsing monitoring.
Issues Workflow
Triage, assign, and resolve spelling/SEO/security issues via kanban and filters.