Performance Insights
Core Web Vitals and performance metrics from crawled pages.
User goal
Find slow pages and regression in LCP, CLS, INP.
- Tier
- Pro+
- Nav label
- Performance
- Route
- /projects/{project}/performance
- Gates
- —
Prerequisites
- Performance data from audit/crawl
QA focus
- Metrics match lab data tolerance
- Worst URLs ranked correctly
Overview
Performance Insights surfaces Core Web Vitals and related metrics from crawled pages so you can find slow URLs and confirm improvement after a fix.
What you get
- Distribution of vitals and a ranked list of worst offenders
- Per-URL vitals breakdown
- A place to compare metrics after you re-crawl
How it works
- Open Performance on the project once audit or crawl performance data exists
- Sort the URL list and open a slow row for detail
- Re-run the audit or crawl, then refresh to verify metric improvement (lab vs field can differ)
Common issues & false alarms
- Lab vs field variance
Interactive guide
Step of
What to do
Where to find it
Expected (pass)
Negative cases
Tips
Screenshot pending capture
All steps (reference)
-
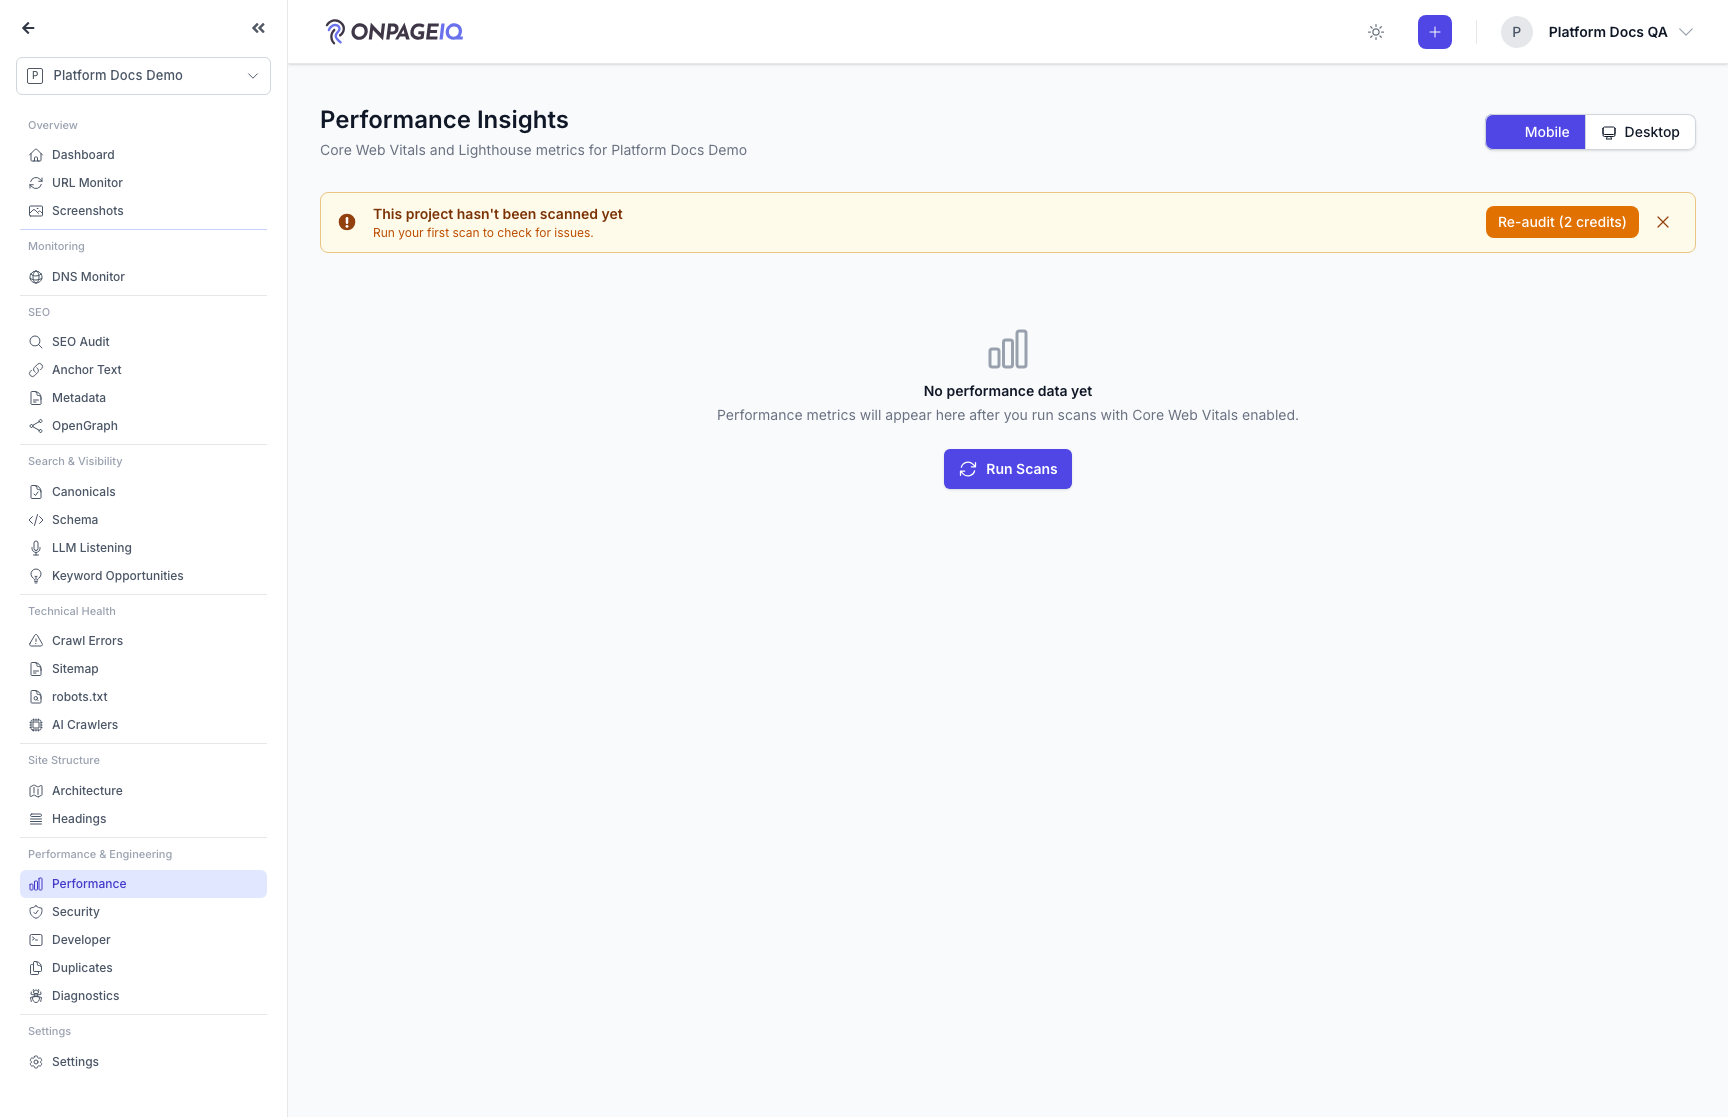
Step 1. Performance overview
Distribution of vitals and worst offenders.
What to do: Open projects.performance
Where: projects.performance
Expected (pass)
- Charts render
- URL list sortable
-
Step 2. URL performance detail
Per-URL vitals breakdown.
What to do: Click slow URL row
Where: projects.performance
Expected (pass)
- Detail matches aggregate
-
Step 3. Compare after fix
Re-run audit and verify metric improvement.
What to do: Re-crawl → refresh performance
Where: projects.performance
Expected (pass)
- Updated metrics after new crawl
Related guides
Runtime Diagnostics
Browser console errors, network failures, and CSP violations from audited pages.
Developer Insights
The engineering read on an audit: Core Web Vitals, JavaScript and third-party scripts, caching and compression, API health, and security-header coverage.
SEO Audit
Site-wide SEO audit dashboard with crawl status, scores, and deep-dive sub-routes.
H1 Above the Fold
Check whether each page’s primary H1 is visible without scrolling — with annotated desktop/mobile screenshots you can trust-but-verify in SEO Audit.